A/B testing QR codes sounds simple: make two versions, split traffic, and keep the winner. In practice, most teams introduce bias long before the scan happens, then make creative, budget, and placement decisions based on flawed data. That matters because QR codes sit at the intersection of offline media, mobile behavior, landing page performance, and analytics implementation. A weak test does not just waste a print run; it can distort how a brand evaluates direct mail, retail signage, packaging, out-of-home placements, event materials, and product inserts. In my work on QR code marketing strategy, I have seen teams blame the code design when the actual problem was sample contamination, inconsistent destinations, or missing UTM governance. To run useful experiments, you need a clear hypothesis, controlled variables, reliable tracking, and an understanding of what a scan can and cannot prove. This article explains the most common A/B testing mistakes with QR codes, why they happen, and how to avoid them so your tests produce decisions you can trust.
Testing too many variables at once
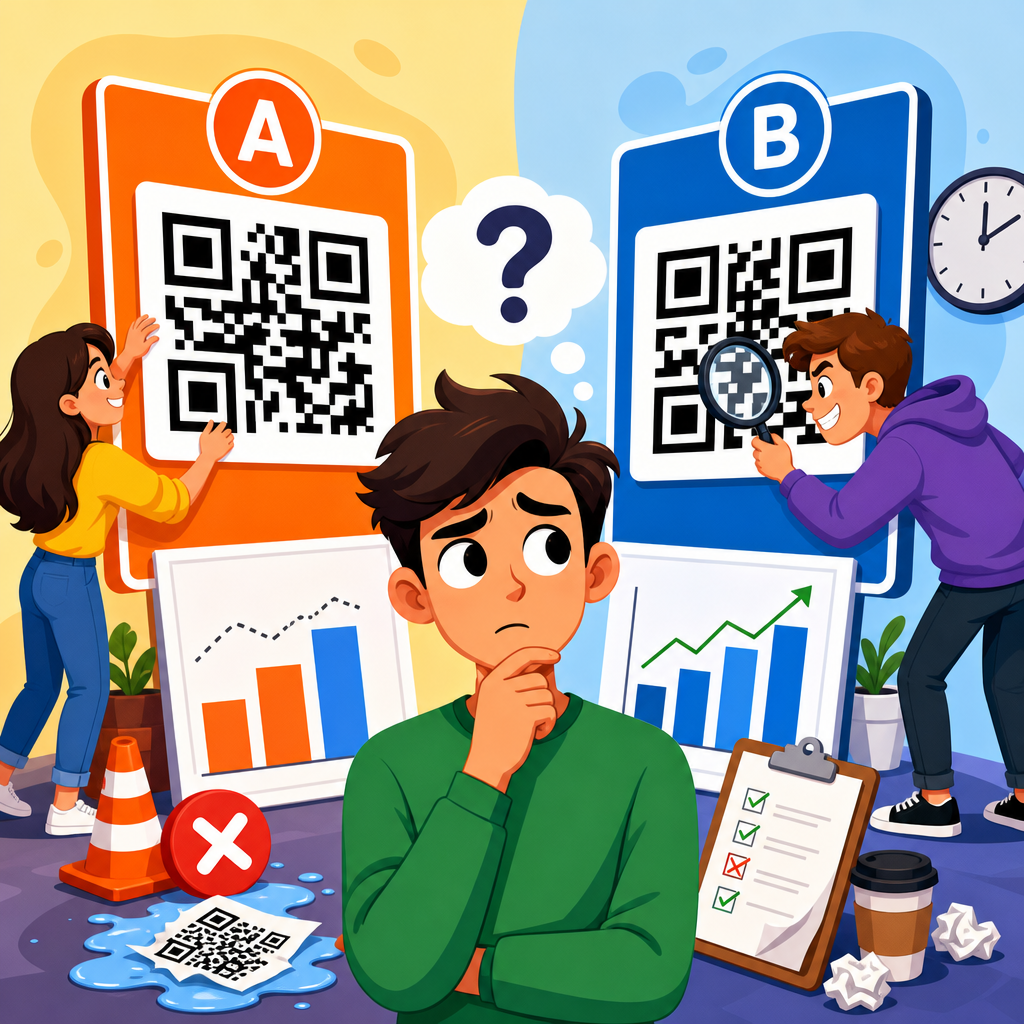
The most common mistake in A/B testing QR codes is changing multiple elements at the same time and then attributing the outcome to the wrong factor. A team may alter the call to action, the code size, the surrounding graphics, the offer, and the landing page headline in one test. If Version B gets more scans or conversions, nobody knows which change caused the lift. In print and physical environments, that ambiguity is expensive because retesting often requires another production cycle.
A clean QR code experiment isolates one primary variable. If you want to learn whether code size affects scan rate on a poster, keep the destination URL, CTA, placement height, contrast, and creative identical. If you want to test offer framing, keep the QR code treatment and physical placement constant while changing only the message, such as “Get 10% off” versus “Claim your first-order discount.” This is not academic purity; it is the only way to create a valid basis for future rollout decisions.
I generally advise teams to define one success metric and one independent variable before any asset is produced. For scan-focused tests, that variable might be code size, placement, or CTA wording. For conversion-focused tests, the variable often belongs on the landing page rather than the QR code itself. When teams skip this discipline, they end up learning less than they think and overspending on “optimization” that cannot be replicated.
Using the wrong success metric
Another major error is optimizing for scans when the business goal is conversion, revenue, lead quality, app installs, or store visits. Scan rate is useful, but it is only the top of the funnel. A QR code with an aggressive CTA can drive more scans and still produce fewer purchases because it attracts lower-intent users or promises something the landing page does not immediately deliver.
The right metric depends on the context. On packaging, repeat buyers may scan to access recipes, warranty registration, or loyalty benefits, so downstream engagement matters more than raw scan count. In direct mail, cost per qualified lead may be the most relevant measure. At an event booth, scan-to-form-completion rate often tells you more than total scans, because accidental or curiosity-based scans are common in crowded environments.
Good measurement uses a metric hierarchy. Primary metrics could include completed purchases, booked demos, or verified leads. Secondary metrics might include scans, landing page bounce rate, time to first interaction, and form completion rate. Guardrail metrics matter too: page load time, duplicate submissions, and return visits can reveal hidden problems. If your QR code test improves one number while damaging the outcome the business actually values, it is not a win.
Ignoring scan context and placement effects
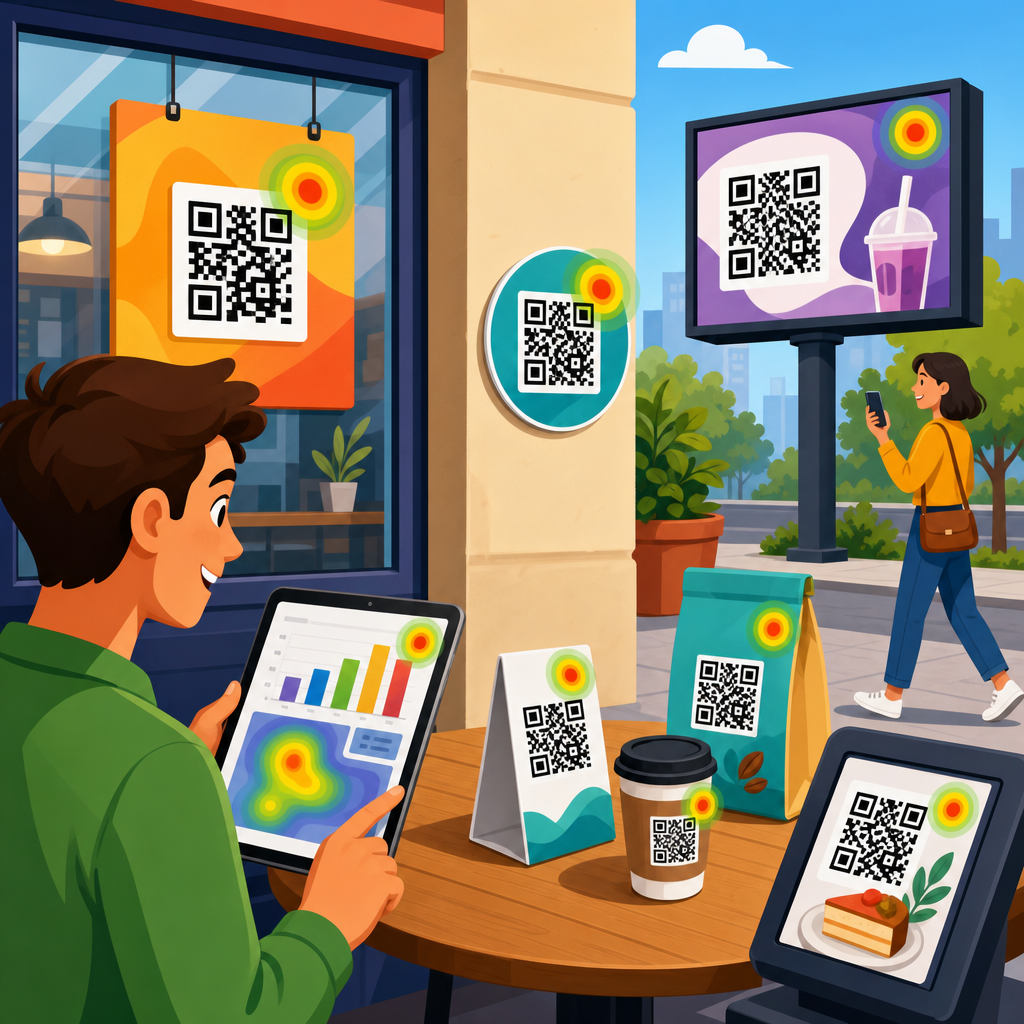
QR code performance is heavily shaped by where, when, and how people encounter the code. Many failed tests compare two versions placed in different physical conditions and then treat the results as a fair creative comparison. A code near a store entrance may outperform one near the checkout not because the design is better, but because foot traffic is slower and lighting is stronger. A code on a bus shelter and a code in a subway station face different dwell times, network conditions, and scanner readiness.
Placement effects are especially strong in outdoor and retail settings. Viewing angle, mounting height, glare, ambient light, distance, and crowd flow all influence whether a user notices and successfully scans the code. The surrounding copy matters too. “Scan to see menu” creates different intent than “Scan for today’s offer,” even if both lead to the same URL. Testing versions across unequal contexts produces noisy data that looks precise only because dashboards return clean percentages.
To avoid this mistake, randomize placement where possible or rotate versions across identical environments. In-store, alternate versions by aisle endcap or by store cluster with matched traffic profiles. In direct mail, randomize at the recipient level using print variable data. For out-of-home, use matched locations with similar impressions, dwell time, and demographic patterns. If context differs, document it and treat the result as directional rather than definitive.
Failing to standardize tracking and attribution
Many QR code A/B tests break at the analytics layer. One version points to a shortened URL with UTM parameters, another redirects through a QR platform, and a third lands on a page without campaign tags. The scans are real, but attribution becomes fragmented across analytics tools, CRM records, and ad platforms. Once that happens, teams start reconciling reports instead of learning from the test.
Reliable QR code tracking requires consistency in how links are generated, tagged, redirected, and recorded. At minimum, each variant needs a unique destination identifier, standardized UTM taxonomy, and event naming conventions that match your analytics plan. Platforms such as Google Analytics 4, Adobe Analytics, Bitly, and dynamic QR management tools can all work, but only if their definitions align. “Scan” should mean the same thing across reports, and conversion events should be deduplicated between web analytics and downstream systems such as HubSpot or Salesforce.
| Testing area | Common mistake | Better practice |
|---|---|---|
| Variant setup | Changing design, CTA, and destination together | Test one primary variable and hold all others constant |
| Measurement | Judging success by scans alone | Track scans, conversions, and a primary business KPI |
| Placement | Comparing versions in unequal physical environments | Randomize or rotate across matched locations |
| Attribution | Using inconsistent UTM tags and redirects | Apply a shared tagging and naming framework |
| Sample size | Calling a winner too early | Set a minimum sample and decision rule in advance |
In my experience, redirect logic deserves extra scrutiny. Dynamic QR codes are powerful because you can update destinations without reprinting assets, but redirects can also introduce latency, tracking loss, or accidental caching behavior if configured badly. Test the full path on iOS and Android, across major browsers, and over weak mobile connections. A small implementation error can make Variant B look worse when the real issue is a broken parameter handoff.
Stopping tests too early or using samples that are too small
Teams often declare a winner after seeing a short-term spike, especially when one version appears to outperform in the first few days. That is risky. QR code traffic can be uneven by weekday, weather, store traffic, event timing, seasonality, and media exposure. A poster near a venue may surge before a game and go quiet after. A mail drop may generate scans in waves as households receive pieces at different times. Early results can be misleading.
Before launching, set a minimum sample size and decision rule. The exact threshold depends on your baseline conversion rate and the lift you care about detecting, but the principle is universal: do not peek at the data and stop when the chart feels convincing. Use a power calculation or an experiment calculator, define significance criteria, and commit to the analysis window in advance. If your traffic volume is low, extend the test or simplify the question rather than making a confident decision from weak evidence.
Also watch for novelty effects. A new visual treatment may drive curiosity scans at first, then regress as attention normalizes. Conversely, a lower-performing version may catch up once distribution evens out across locations. Good A/B testing QR codes requires patience, not just tooling. Decisions based on underpowered samples are one of the fastest ways to bake false beliefs into a marketing program.
Overlooking mobile landing page experience
A QR code is only an access point. If the mobile landing page is slow, cluttered, or mismatched to the promise on the physical asset, the test result will mislead you. I have reviewed campaigns where a redesigned QR code seemed to reduce conversion, but the actual cause was a mobile page update that increased load time from under two seconds to more than four. On cellular networks, that difference is material.
Because QR interactions happen on mobile devices, post-scan experience should be part of every experimental plan. That includes page speed, above-the-fold clarity, form length, autofill compatibility, Apple Pay or Google Pay availability, app deep-link behavior, and whether the user can complete the action one-handed in a distracting environment. A restaurant table tent, product package, and trade show banner all create different attention windows. Your landing page should match that context.
The practical fix is straightforward. Freeze the landing page during a QR code design test unless the landing page is the thing being tested. Audit Core Web Vitals, compress assets, reduce redirects, and confirm that analytics events fire reliably on mobile Safari and Chrome. If the scan context is high-friction, shorten forms and remove nonessential navigation. A QR code cannot rescue a weak mobile journey, and a weak mobile journey can invalidate an otherwise sound test.
Neglecting scanner usability and code quality
Some A/B tests compare versions that are not equally scannable. One code may be too small, printed on reflective stock, placed over a busy image, or rendered with weak contrast. Another may use brand colors that look attractive in mockups but reduce camera recognition under low light. When usability differs, the experiment stops being a marketing test and becomes a technical failure.
QR code quality is governed by practical constraints. Quiet zone spacing must be preserved. Contrast should be high enough for common smartphone cameras. Error correction helps, but it does not compensate for poor production decisions. Curved surfaces on bottles and cans can distort the code. Matte and gloss finishes behave differently under store lighting. Distance matters: a code meant to be scanned from several feet away needs different sizing than one on a brochure held in hand.
Always test printed proofs in realistic conditions before launch. Scan from multiple devices, at expected distances, under direct and indirect light, and with the page partially wrinkled or moving if that reflects actual use. This is where hands-on testing beats software previews. If one variant has even a slight usability disadvantage, any comparison of CTA wording, offer, or branding becomes unreliable because scan friction has already skewed the top of the funnel.
Forgetting audience segmentation and intent differences
Not all scanners behave the same way, yet many teams pool everyone into one report and look for a single winner. That approach hides important differences in audience intent. New customers scan differently from existing customers. Event attendees differ from in-store shoppers. A QR code on packaging often serves owners seeking support or instructions, while a code on direct mail usually targets prospects evaluating an offer. Combining those populations can flatten meaningful patterns.
Segmentation should be planned before the test starts. Useful cuts include location type, device category, campaign source, customer status, daypart, and new versus returning visitors. If privacy and consent allow, connecting scans to CRM segments can reveal whether the “winning” variant mainly improved low-value traffic while underperforming with high-value customers. That insight changes rollout decisions dramatically.
This is also why message alignment matters. A QR code that says “Learn more” may work better for upper-funnel audiences, while “Start free trial” may convert better for warmer prospects. If you test both messages across mixed-intent environments, the averages may suggest no difference even though each message wins with a distinct segment. Better analysis asks not only which version won, but for whom and under what conditions it won.
Missing operational safeguards and documentation
The final mistake is operational: running tests without a documented protocol. Teams often lack a naming convention, launch checklist, ownership map, archive of creatives, or a record of what changed between versions. Weeks later, they have scan totals but cannot reconstruct the exact conditions of the test. That makes replication difficult and cross-team learning almost impossible.
A robust QR code testing process includes a hypothesis statement, variant screenshots, print specifications, destination URLs, UTM schema, analytics event definitions, sample size target, start and end dates, and a list of exclusions such as damaged placements or store outages. It should also note what not to change during the test, including landing page components, bid strategies, or audience targeting rules that could contaminate results. This is especially important when QR codes are part of a broader omnichannel campaign.
Documentation compounds value over time. Once you record how code size performed on packaging versus retail signage, or how a direct CTA compared with a curiosity CTA for event traffic, future tests become sharper and cheaper. The purpose of A/B testing QR codes is not to win one campaign; it is to build a repeatable decision system for all future QR code marketing and strategy work.
The best A/B testing QR codes programs are rigorous, boring in the right places, and highly disciplined about measurement. They isolate one meaningful variable, choose metrics tied to business outcomes, control for placement and audience differences, and protect the post-scan mobile experience. They also respect the physical realities of QR code scanning, from print quality and contrast to viewing distance and environmental conditions. When those basics are ignored, test results become stories marketers tell themselves rather than evidence they can act on.
If you want better results, start with process before creativity. Create a testing brief, standardize your tracking taxonomy, validate code usability in real conditions, and commit to a sample size before launch. Then analyze outcomes by segment, not just in aggregate, and archive what you learn for the next campaign. Done well, A/B testing QR codes helps you improve scan rate, conversion rate, and media efficiency with confidence. Use this hub as your baseline, then apply the same discipline across every QR code marketing and strategy initiative you run.
Frequently Asked Questions
What is the most common mistake teams make when A/B testing QR codes?
The most common mistake is assuming the test starts at the moment of the scan. In reality, bias usually enters much earlier. With QR codes, people first have to notice the code, understand why they should scan it, trust where it will lead, and have enough time and motivation to act. If version A is printed larger, placed at eye level, paired with a stronger call to action, or shown in a cleaner visual environment than version B, then you are not testing the QR code alone. You are testing visibility, context, creative hierarchy, and user intent all at once.
This matters because teams often declare a winner based on scan volume without asking whether the conditions were truly comparable. A code on product packaging may perform differently from a code on a shelf talker not because the destination page is better, but because one was seen during a high-intent shopping moment and the other was ignored in a crowded retail setting. The same issue happens in direct mail, out-of-home placements, event signage, and in-store displays. When exposure conditions are uneven, your results reflect placement bias, not performance differences.
A better approach is to define exactly what is being tested and hold as many surrounding variables constant as possible. If you want to test the landing page, keep the same QR code size, location, design treatment, surrounding copy, and traffic source while routing users to different destinations. If you want to test the QR code creative itself, keep the destination and placement identical. Strong A/B testing with QR codes depends on isolating one meaningful variable at a time. Otherwise, the “winner” may simply be the version that had the easiest path to getting scanned.
Why is split traffic harder to control with QR codes than with digital A/B tests?
In digital environments, traffic can usually be randomized at the user level. Platforms can assign visitors evenly, track exposures, and reduce contamination between variants. QR codes are different because they often live in physical environments where exposure is influenced by geography, timing, inventory distribution, store layout, print quality, weather, foot traffic patterns, and user behavior. That makes “50/50 split traffic” much harder to achieve than it sounds.
For example, one QR code version might appear in urban stores with heavier traffic, while the other appears in suburban locations with different customer demographics and purchase intent. One direct mail version may land earlier in the week, and the other may arrive just before a holiday or promotion. One package variant may be distributed through a retailer with stronger in-store merchandising. Even if scan counts look comparable at first glance, the underlying audience conditions may be very different.
Another complication is that QR code tests often mix offline exposure with digital outcomes. A user might see the code in one place, wait hours before scanning, or revisit the destination later through another channel. If attribution rules are weak, teams may incorrectly credit or exclude conversions. This creates a false sense of precision around traffic allocation.
To reduce these problems, teams should plan for controlled distribution wherever possible. Match stores, regions, print runs, and timing windows carefully. Use unique tracking parameters for each variant, but also document where and when each variant appeared. If randomization is not realistic, acknowledge that the test is quasi-experimental rather than a clean A/B test. That distinction matters because it should influence how confidently you interpret the results. With QR codes, operational discipline is just as important as analytics.
How do analytics and attribution errors distort QR code test results?
Analytics errors are one of the most damaging and underappreciated issues in QR code testing. Teams often focus heavily on creative differences while overlooking whether scans, sessions, conversions, and downstream actions are being measured consistently. If the analytics setup is flawed, the test can appear decisive even when the underlying data is incomplete, duplicated, or misattributed.
A common problem is inconsistent tracking between variants. One QR code may route through a redirect that preserves campaign parameters correctly, while another loses them due to app behavior, browser privacy settings, or a faulty redirect chain. In other cases, the landing pages may fire different analytics events, load at different speeds, or trigger duplicate sessions. Mobile operating systems, in-app browsers, consent banners, and ad blockers can all affect what gets recorded after the scan.
Attribution windows also create confusion. Someone may scan a QR code, browse briefly, leave, and return later through paid search, email, or direct traffic before converting. If your reporting only credits the last touch, the QR code may look weaker than it actually is. On the other hand, if every later action is automatically tied back to the scan, the QR code may receive too much credit. Either mistake leads to bad budget and channel decisions.
The solution is to validate the entire measurement path before launching the test. Confirm that each variant uses clean and distinct URLs or parameters, that redirects are intentional and consistent, and that analytics events are firing the same way across destinations. Test on multiple devices and scanning contexts, including native camera apps and social or messaging in-app browsers. Review server-side logs, landing page analytics, and conversion reporting together rather than relying on one dashboard. Good QR code testing is not just about generating scans; it is about preserving trustworthy data from the first interaction through the final business outcome.
Should teams judge QR code tests by scan rate alone?
No. Scan rate is useful, but on its own it is an incomplete and sometimes misleading metric. A high scan rate may indicate that a QR code is visible, intriguing, or supported by strong call-to-action copy, but it does not automatically mean the experience is effective. If users scan and then bounce because the landing page is slow, irrelevant, confusing, or poorly optimized for mobile, the campaign may create activity without delivering business value.
That is especially important because QR codes sit at the intersection of offline media and mobile conversion journeys. A code on packaging may generate frequent scans from curious users who are not ready to buy. A code in direct mail may produce fewer scans but stronger conversion intent. A retail sign may drive product detail views, store locator visits, coupon saves, or app downloads rather than immediate purchases. If you only compare raw scan totals, you risk rewarding the version that generates the most top-of-funnel activity instead of the one that produces the best downstream outcomes.
Strong evaluation should connect the test to the actual goal. Depending on the campaign, that may mean comparing qualified sessions, engagement depth, lead submissions, offer redemptions, purchases, assisted conversions, or revenue per scan. It can also be helpful to examine drop-off points. If one variant earns fewer scans but far better completion rates after the landing page, it may be the more profitable option. Conversely, if a version increases scans by promising something the page does not deliver, it may hurt trust and long-term performance.
The best practice is to establish a metric hierarchy before the test begins. Use scan rate as an early indicator, not the sole judge. Pair it with landing page engagement, conversion quality, and operational context. That way, your “winner” reflects real business impact rather than surface-level interaction.
How can brands run more reliable QR code A/B tests across packaging, retail, and direct mail?
Reliable QR code testing starts with discipline in test design. First, choose one variable to test at a time. That could be the call to action, the visual treatment around the QR code, the incentive, the landing page experience, or the physical placement. Trying to test multiple changes at once may feel efficient, but it makes the result difficult to interpret. If performance changes, you need to know why.
Next, standardize the physical conditions as much as possible. Keep code size, contrast, quiet zone, printing quality, and scanability consistent. Make sure each code is easy to scan under realistic conditions, including different lighting, angles, and device types. In retail or out-of-home environments, placement height, surrounding clutter, and dwell time matter enormously. In direct mail, format, panel location, and offer framing can influence response before anyone interacts with the code. On packaging, product category, shelf position, and purchase stage can change user intent. These are not background details; they are core parts of the test environment.
Brands should also align operations and analytics before rollout. Assign clear naming conventions, tracking parameters, and reporting rules to each variant. Document where each version is distributed, when it goes live, and what audience it reaches. Build a quality assurance process that checks print accuracy, redirect behavior, mobile page speed, event firing, and conversion tracking. If inventory constraints or channel realities prevent true randomization, note that upfront and interpret results with appropriate caution.
Finally, use enough time and sample size to avoid reacting to noise. QR code performance can fluctuate based on location traffic, seasonality, promotions, and daypart. A small early lead may disappear once broader exposure occurs. Let the test run long enough to capture a representative range of conditions, then review both quantitative data and field observations. When brands combine careful variable control, sound analytics, and real-world operational awareness, QR code A/B testing becomes far more reliable and far more useful for making decisions about creative, budget, placement, and channel strategy.