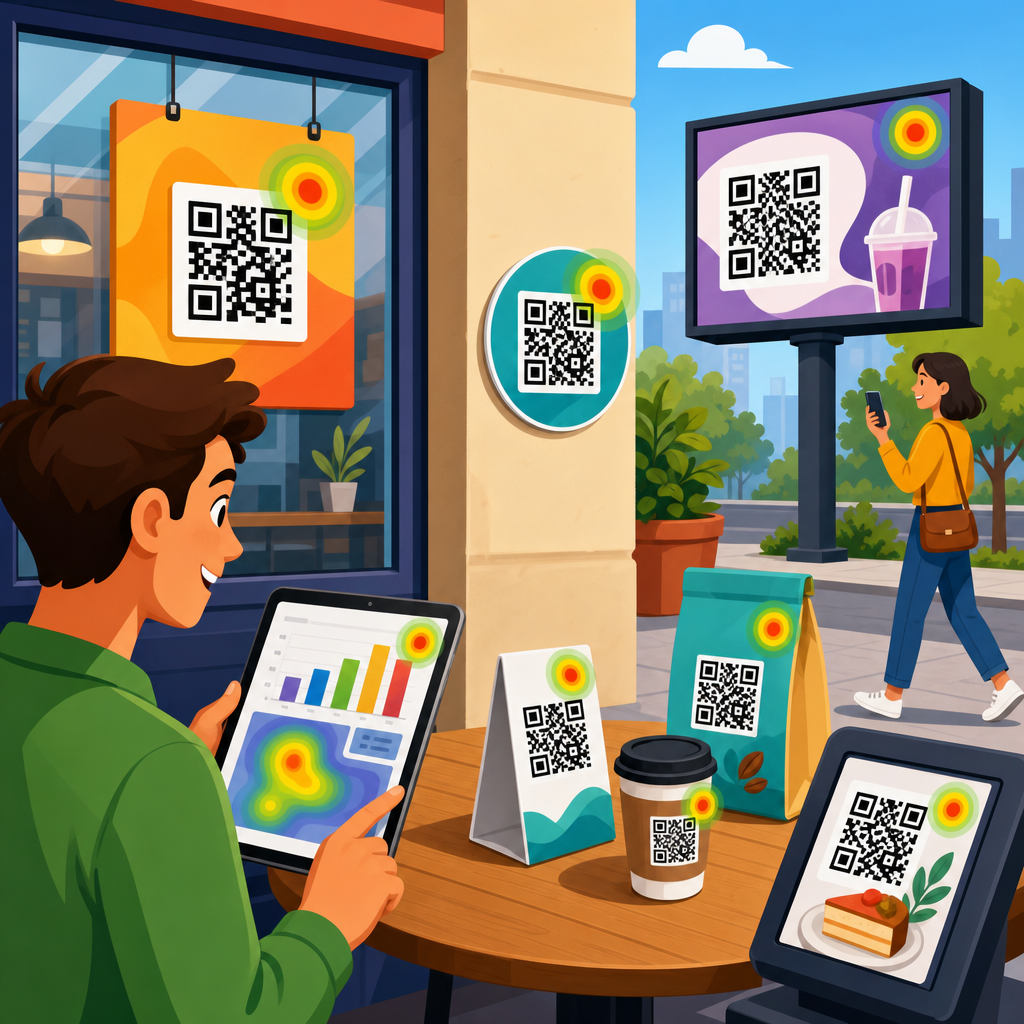
Tracking QR code scans effectively turns a simple square image into a measurable marketing channel. In practice, that means knowing not only how many people scanned, but also where they scanned, when they scanned, what device they used, and what happened after the scan. QR code tracking is the process of collecting, organizing, and interpreting those signals so a marketer can connect offline touchpoints to digital outcomes. For teams running print ads, product packaging, direct mail, in-store displays, event signage, restaurant menus, or field sales materials, that visibility matters because budget decisions depend on evidence, not guesswork.
A QR code can be static or dynamic. A static code points directly to a final destination and usually offers little or no native reporting. A dynamic code routes through a short tracking URL before sending the user onward, which makes analytics possible and allows the destination to be changed later without reprinting the code. That distinction is foundational. If a campaign needs reliable scan reporting, dynamic QR codes are the standard choice. They support metrics such as total scans, unique scans, timestamp, approximate location from IP, operating system, and referral context, and they can be integrated with analytics platforms for deeper attribution.
This matters more now because QR behavior has normalized across industries. Smartphone cameras read codes natively, consumers understand the interaction, and offline-to-online journeys are no longer edge cases. I have seen teams waste months using untagged links behind codes, then discover they cannot separate scans from other traffic sources. I have also seen a modest improvement in tracking setup transform campaign reviews: once every flyer, shelf talker, and postcard had a distinct code with consistent naming, the highest-performing placements became obvious. Good QR code analytics does not begin in a dashboard. It begins in campaign design, URL structure, governance, and a clear definition of success.
For a hub page on tracking and analytics, the essential questions are straightforward. What data can a QR code capture? How do you structure links for attribution? Which metrics actually matter? How do you compare one placement against another? What tools should you use, and what privacy limits apply? The sections below answer those questions directly and set up the methods that support every related article in a broader QR code marketing and strategy program.
What QR code scan tracking actually measures
QR code scan tracking measures an interaction event created when a user scans a code and requests its destination. At minimum, a competent platform records total scans and scan time. Better platforms also estimate unique users, geolocation at city or regional level based on IP, device type, operating system, browser, and sometimes the day-of-week pattern that reveals when attention peaks. These are useful operational metrics, but they are not the same as business outcomes. A scan is an entry point. The real objective may be a purchase, form submission, app install, coupon redemption, call, booking, or store visit.
That distinction is why scan data should be separated into three layers. The first layer is scan volume: total scans, unique scans, repeat scans, and scan velocity over time. The second layer is context: where the code was placed, the creative around it, the audience segment, and the destination page experience. The third layer is conversion: what happened after the landing page loaded. Without all three layers, reporting looks active but remains shallow. For example, a poster in a train station may generate many scans, but if the landing page is slow on mobile or asks for too much information, conversion rate may stay low. The code did its job; the experience after the scan did not.
One practical rule: treat QR scans as top-of-funnel acquisition unless the code appears at a later decision point, such as on packaging for reorders or on invoices for payment. That framing helps set realistic benchmarks. A code on a billboard will rarely convert like a code on a product box because intent differs dramatically. Effective tracking starts by mapping each QR placement to its stage in the customer journey and assigning the right success metric to that stage.
Static versus dynamic QR codes for analytics
Dynamic QR codes are the operational standard for serious tracking because they separate the printed code from the final URL. Instead of encoding the destination directly, the code points to a managed redirect. That redirect logs the scan, then forwards the visitor to the chosen landing page. This architecture creates two major advantages. First, the destination can be updated without changing the printed asset. Second, analytics can be collected consistently across channels and time periods. Most enterprise QR platforms, including Bitly, QR Code Generator PRO, Flowcode, and Beaconstac, use this model.
Static codes still have uses. If the destination will never change, the code is for internal operations, and privacy requirements prohibit third-party redirects, a static code can be appropriate. But the tradeoff is limited measurement. You may recover some downstream data through analytics tags on the destination page, yet you will lose clean scan counts and often the ability to distinguish one physical placement from another. In campaign work, that limitation quickly becomes expensive. If the same static code is printed on ten assets, attribution becomes blurred immediately.
In field deployments, I recommend dynamic codes even for small tests because the learning value outweighs the minor setup overhead. A restaurant chain, for example, can use one landing page for seasonal offers but assign unique dynamic codes to window clings, table tents, receipts, and takeout packaging. The offer remains the same; the tracking becomes granular. When results come in, operations can identify not just whether the promotion worked, but which touchpoint prompted action most efficiently.
Campaign structure and naming conventions that prevent bad data
Most QR reporting problems are not technical failures. They are naming failures. If assets are labeled inconsistently, teams cannot compare results across markets, locations, or time periods. The fix is a controlled naming convention applied before any code is generated. Every code should map to a campaign taxonomy that includes brand, region, channel, asset type, placement, audience, offer, and date. A concise identifier such as brand_region_channel_asset_offer_q3 can be enough if used consistently.
Landing page URLs should also carry structured tracking parameters. UTM tags remain the most practical standard because platforms such as Google Analytics 4 recognize them cleanly. A direct mail campaign might use utm_source=direct_mail, utm_medium=qr, utm_campaign=spring_membership, and utm_content=postcard_a. An in-store display for the same offer would keep the campaign name but change source or content to isolate placement performance. This is how you compare like with like. The QR platform reports scans; the analytics platform reports sessions, engagement, and conversions; the shared parameters let those reports align.
Teams should document one owner for taxonomy governance. Without ownership, regional managers invent their own labels, duplicate campaigns proliferate, and reporting becomes unreliable. A simple spreadsheet or campaign intake form can enforce standards. This sounds administrative, but it is the difference between insight and noise. When every code has a defined purpose, a unique identifier, and a tagged destination, analysis becomes fast and credible.
Core metrics and how to interpret them
The most useful QR code metrics combine scan behavior with post-scan performance. Looking at one without the other creates false conclusions. The table below summarizes the key measures I use in campaign reviews and what each one actually tells you.
| Metric | What it indicates | Common mistake | Best use |
|---|---|---|---|
| Total scans | Overall response volume | Treating volume as success by itself | Compare reach across placements |
| Unique scans | Approximate number of distinct scanners | Assuming perfect person-level accuracy | Estimate audience breadth |
| Scan-to-session rate | How many scans became usable site visits | Ignoring page load issues and redirects | Diagnose technical friction |
| Conversion rate | Percent of visitors who completed the goal | Comparing unlike intents across channels | Measure landing page effectiveness |
| Time and day pattern | When attention peaks | Overreacting to one short spike | Optimize scheduling and staffing |
| Location distribution | Where scans originated geographically | Assuming exact physical placement confirmation | Validate market response |
| Device and OS mix | Technical context of scanners | Ignoring mobile page compatibility | Prioritize experience testing |
Two interpretation rules matter. First, benchmark within similar contexts. Compare a shelf tag against other shelf tags, not against packaging or outdoor ads. Second, investigate drop-off between total scans, sessions, and conversions. If scans are high but sessions are low, the redirect or landing page may be slow. If sessions are healthy but conversions lag, the offer or page design likely needs work. Good analytics helps locate the exact leak in the funnel.
Tools, integrations, and dashboard setup
An effective stack usually includes three components. The first is a QR management platform that generates dynamic codes and records scan events. The second is a web analytics platform, most commonly Google Analytics 4 or Adobe Analytics, that tracks behavior after the click-through. The third is a reporting layer such as Looker Studio, Tableau, or Power BI that combines scan data with campaign and conversion data. For teams with a CRM, adding Salesforce or HubSpot creates a fourth layer: lead and revenue attribution.
The integration pattern is straightforward. The QR platform captures the scan and redirects to a URL containing campaign parameters. The landing page analytics platform reads those parameters and records the visit, engagement events, and conversion events. A dashboard then joins scan totals, sessions, conversion rate, and revenue by campaign ID or UTM fields. If the business has call tracking, coupon redemption, or point-of-sale data, those can be blended in as offline outcomes. That is how an operations team can prove that a code on packaging drove repeat orders, not merely curiosity.
Dashboard design should favor decision-making over novelty. I advise one executive summary and one analyst view. The executive view should show scans, unique scans, sessions, conversions, conversion rate, and top-performing placements. The analyst view should include time series, device splits, market filters, and landing page comparisons. Keep definitions visible. If unique scans are device-based estimates rather than authenticated users, label them clearly. Clean reporting builds trust and reduces time spent debating methodology.
Testing, privacy, and ongoing optimization
QR tracking is only useful when the underlying experience is tested. Before launch, scan every code on both iOS and Android, across multiple camera apps, and on weak cellular connections. Confirm that redirects resolve quickly, pages are mobile-friendly, forms are short, and analytics events fire correctly. I also recommend printing samples at actual production size because codes that work on a desktop mockup may fail on textured packaging, curved surfaces, or low-contrast signage. ISO/IEC 18004 defines the technical specification for QR codes, but practical scanability still depends on size, contrast, quiet zone, and placement.
Privacy and compliance deserve equal attention. QR platforms often use IP-based location estimates and device metadata, which may qualify as personal data depending on jurisdiction and implementation. Teams should review cookie consent behavior, data retention, processor agreements, and whether redirect domains align with company policy. Avoid collecting more than you need. For most marketing analysis, aggregated scan and conversion trends are sufficient. If you do connect scans to identifiable customer records, document the lawful basis and disclose tracking transparently.
Optimization is a continuous loop. Start by isolating one variable at a time: call-to-action text, code placement, landing page headline, offer structure, or form length. Then read the combined metrics in sequence. If a revised poster generates more scans but lower conversion, the new creative may attract broader but less qualified interest. If packaging codes show fewer scans yet higher average order value, that placement may still be more profitable. The best QR code analytics programs do not chase vanity counts. They use disciplined tracking to improve real business outcomes.
Effective QR code scan tracking connects physical marketing to digital proof. The foundation is simple: use dynamic QR codes, apply disciplined naming conventions, tag every destination URL, and connect scan data to downstream analytics. From there, focus on the metrics that explain performance, not just activity. Total scans show response volume, but sessions, conversions, revenue, and placement context reveal whether a campaign actually worked. When those signals are joined in a clear dashboard, QR codes become accountable assets instead of decorative shortcuts.
The main benefit of strong tracking is better decision-making. You can identify which placements deserve more budget, which landing pages need improvement, which offers resonate by audience, and where technical friction is suppressing results. That clarity is especially valuable in mixed-channel programs where print, retail, packaging, events, and direct mail all compete for attention. With a consistent measurement model, QR campaigns can be compared fairly across formats and over time, making optimization practical rather than speculative.
As the hub for QR code tracking and analytics, this topic should guide every related effort in your broader QR code marketing and strategy program. Build the measurement plan before you print, test every scan path before launch, and review performance against business outcomes after launch. If you tighten those three steps, your QR codes will produce data you can trust and insights you can act on. Start by auditing your current codes, replacing untracked links, and standardizing the way every new campaign is measured.
Frequently Asked Questions
1. What does it actually mean to track QR code scans effectively?
Tracking QR code scans effectively means going beyond a basic scan count and turning each scan into useful marketing data. A well-tracked QR code can show how many people scanned, when they scanned, where they were located, what type of device they used, and which campaign, placement, or printed asset drove the interaction. More importantly, effective tracking connects the scan to what happened next, such as a page view, form submission, purchase, app download, coupon redemption, or other conversion event. This is what transforms a QR code from a static image into a measurable performance channel.
In practical terms, effective tracking usually starts with a dynamic QR code rather than a static one. A dynamic code sends the user through a trackable redirect before landing on the final destination, which makes it possible to log scan activity and update the destination URL later without reprinting the code. From there, marketers often add campaign parameters, analytics integrations, and conversion tracking so they can evaluate not just engagement, but business impact. The goal is to understand the full journey from offline touchpoint to online action, making it easier to compare placements, optimize creative, and prove return on investment.
2. What data should marketers pay attention to when measuring QR code performance?
The most useful QR code metrics depend on campaign goals, but several data points consistently matter. Scan volume is the starting point because it shows raw engagement, but it should never be the only metric you rely on. Time-based data can reveal whether scans spike during store hours, after a direct mail drop, during an event, or after a print ad is published. Location data helps identify which regions, stores, or physical placements are driving interest. Device and operating system data can also be valuable, especially when optimizing landing pages for mobile behavior or diagnosing technical issues that affect user experience.
Beyond scan-level data, the most important layer is post-scan behavior. Marketers should track what users do after they land on the destination page: bounce rate, session duration, pages viewed, add-to-cart actions, lead form completions, purchases, sign-ups, or any other conversion event tied to campaign goals. It is also helpful to compare scan-to-visit and visit-to-conversion performance across different QR code placements. For example, one poster may generate fewer scans but more qualified traffic, while another may drive higher volume but weaker conversion rates. Looking at both engagement and outcomes gives a much clearer picture of actual performance.
3. Why are dynamic QR codes usually better for tracking than static QR codes?
Dynamic QR codes are generally the preferred option for tracking because they provide flexibility and measurability that static codes cannot match. A static QR code contains the final destination URL directly inside the code itself, which means its behavior is fixed once printed or published. If the landing page changes, the campaign needs to be updated, or tracking parameters were set up incorrectly, a static code often has to be recreated and redistributed. That can be costly and inconvenient, especially for packaging, signage, direct mail, or other materials already in circulation.
Dynamic QR codes solve this by pointing to a short redirect URL that can capture scan data before sending the user to the final destination. That redirect layer enables analytics collection, campaign tagging, destination updates, A/B testing, and easier attribution across multiple offline channels. It also allows marketers to reuse the same printed code while changing the content behind it as campaigns evolve. For teams that care about performance measurement, optimization, and long-term campaign management, dynamic codes offer far more control and make it much easier to track scans accurately over time.
4. How can you connect QR code scans to conversions and ROI?
Connecting QR code scans to conversions and return on investment requires a clear measurement framework from the start. First, define the action that matters most for the campaign, such as a purchase, booking, lead submission, email signup, app install, or coupon redemption. Then make sure the QR code sends users to a landing page that is instrumented with analytics and conversion tracking tools. This often includes campaign parameters in the URL, event tracking in a web analytics platform, and conversion goals configured in systems such as analytics dashboards, ad platforms, or CRM software. Without this setup, you may know that scans happened, but not whether they created meaningful results.
To calculate ROI, compare the cost of the QR-driven campaign with the value generated from those tracked outcomes. For example, if a direct mail piece includes a QR code and the landing page records completed purchases, you can estimate revenue directly from scan-driven sessions. If the campaign is lead generation focused, you can track form fills, qualified leads, and downstream sales in the CRM. It is also smart to assign unique QR codes to specific placements, stores, products, or print runs so attribution is more precise. The more tightly scan activity is tied to business outcomes, the easier it becomes to justify spend, identify high-performing placements, and make better future marketing decisions.
5. What are the best practices for setting up QR code tracking so the data is accurate and useful?
Accurate QR code tracking starts with disciplined campaign structure. Use dynamic QR codes whenever possible, create a separate code for each distribution channel or placement you want to measure, and apply consistent naming conventions for campaigns, locations, assets, and audiences. If multiple print pieces share the same code, it becomes much harder to know which one actually drove the scan. Likewise, if campaign parameters are inconsistent, reporting can quickly become messy and unreliable. A clean setup at the beginning prevents confusion later and makes reporting much more actionable.
It is equally important to optimize the user experience after the scan. Send users to a mobile-friendly landing page that loads quickly, aligns closely with the promise of the QR call to action, and makes the next step obvious. Test the QR code across different phones, operating systems, lighting conditions, print sizes, and distances before launch. Make sure analytics tools are firing properly and that redirects do not break attribution. Finally, review the data regularly rather than waiting until the campaign is over. Ongoing monitoring helps you spot unusual drops or spikes, compare placements, refine messaging, and improve conversion performance while the campaign is still live. Effective tracking is not just about collecting data; it is about setting up a system that produces trustworthy insights you can act on.