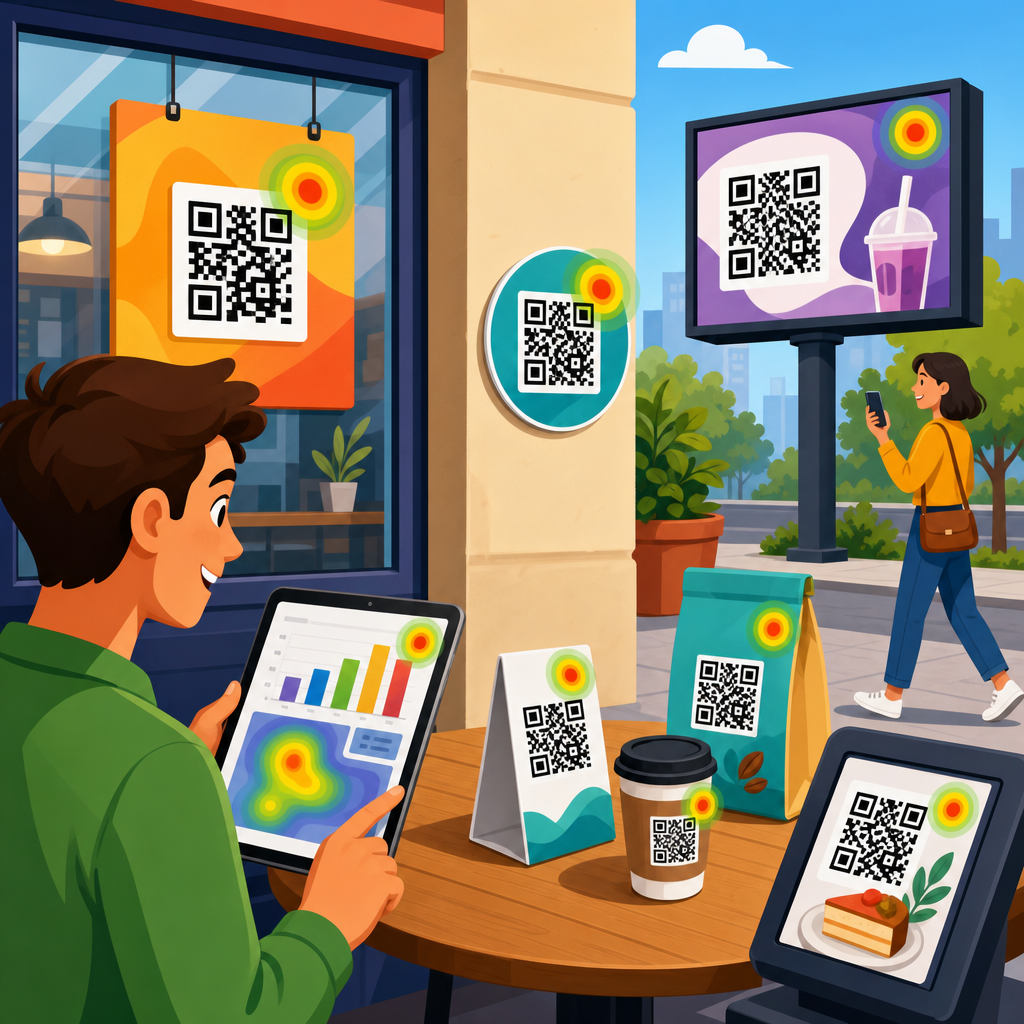
Tracking offline campaigns with QR codes turns posters, packaging, mailers, event signage, and in-store displays into measurable traffic sources instead of expensive guesswork. For marketing teams that need to connect physical exposure to digital action, QR codes provide a practical bridge: a smartphone camera scans a printed code, opens a destination, and records a visit that can be attributed to a specific campaign, placement, audience, or time period. I have implemented QR tracking for retail launches, field events, direct mail, restaurant menus, and product packaging, and the biggest lesson is consistent every time: the value is not the code itself, but the measurement framework behind it.
A QR code, short for Quick Response code, is a two-dimensional barcode that stores data, usually a URL. In campaign measurement, the code is only the visible layer. Underneath it sits a trackable destination, often using UTM parameters, redirect rules, analytics events, and dashboard reporting. Offline campaign tracking means assigning a unique scannable path to each physical asset so you can answer basic but critical questions: Which flyer drove the most visits? Which store window generated scans after hours? Did the conference booth produce qualified leads, or only casual traffic? Which direct mail version converted better by geography?
This matters because offline media is still powerful but historically difficult to measure with precision. Out-of-home advertising can build awareness fast, direct mail can outperform email in certain verticals, and printed packaging often reaches customers at the exact point of use. Yet without a trackable mechanism, teams rely on vanity signals, recall surveys, or blended revenue changes that hide true performance. QR codes reduce that blind spot. They do not solve attribution perfectly, and they cannot capture every impression, but they create a reliable, low-friction interaction point that improves decision-making across creative, placement, budget allocation, and post-campaign optimization.
To make QR code analytics meaningful, you need more than a link shortener and a printable square. You need naming conventions, campaign segmentation, redirect control, analytics integration, scan context, and a plan for what happens after the scan. This hub article covers the full tracking and analytics foundation for QR code marketing strategy: how to structure URLs, what metrics matter, how to compare placements, which tools to use, where attribution breaks down, and how to design campaigns so the data is clean enough to act on. If your goal is to treat offline media with the same performance discipline as digital media, this is the operational starting point.
How QR code tracking works in offline marketing
At a technical level, tracking offline campaigns with QR codes works by assigning a destination URL to each code and recording the resulting session in analytics software. The most common setup uses a campaign URL containing UTM parameters such as source, medium, campaign, content, and term. For example, a retailer might use one code for a window poster and another for a countertop display, both pointing to the same landing page but with different campaign tags. When someone scans, the device opens the URL, the analytics platform logs the visit, and downstream events such as form submissions, purchases, coupon redemptions, or appointment bookings can be tied back to the campaign values.
Static and dynamic QR codes behave differently, and that difference matters for measurement. A static code contains the final destination directly, which means the printed code cannot be edited later. A dynamic code points to a short redirect URL controlled by a QR platform or redirect server. That redirect can then send users to a destination URL with tracking parameters, and it can be updated without reprinting the code. In practice, dynamic codes are usually the better choice for campaign analytics because they support destination changes, scan counts, device reporting, and error correction when a landing page moves.
In real campaigns, I recommend separating three layers: the printed asset, the redirect layer, and the final landing page. The printed asset is the physical object, such as a bus shelter ad. The redirect layer identifies that specific asset and records the scan. The landing page delivers the offer or information. This separation prevents messy reporting and preserves flexibility. If the landing page changes mid-campaign, the code remains valid. If a team later wants to compare placements across cities, the redirect data remains intact. This is the difference between casual QR usage and disciplined tracking.
Building a measurement framework before you print
The most expensive QR code mistake happens before launch: printing assets without a measurement plan. Before generating codes, define the business objective, conversion event, audience segment, and reporting dimensions. A product box code may aim to drive warranty registration. A trade show banner may target demo bookings. A restaurant table tent may promote app installs. The metric you optimize for will change the setup. If the primary goal is lead quality, raw scans are insufficient. If the goal is footfall-to-offer activation, coupon redemptions may matter more than visits. Clear objectives produce cleaner analytics.
Next, standardize campaign taxonomy. Use consistent naming for source, medium, campaign, content, creative variant, and location. I typically reserve source for the channel category, such as print, packaging, or out_of_home; medium for qr; campaign for the initiative name; content for the asset variant; and an internal ID inside the redirect platform for exact placement. Teams that skip taxonomy often end up with fragmented reports where “poster,” “Poster,” and “store-poster” appear as separate rows. Standardization sounds mundane, but it is what makes quarter-over-quarter analysis possible.
You also need operational ownership. Decide who creates codes, who approves destinations, who validates tracking, and who monitors performance after launch. In multi-location businesses, a central marketing team may control naming conventions while local teams manage placement. Without governance, duplicate codes get reused, expired pages remain live, and campaign reports lose credibility. A simple launch checklist helps: confirm mobile landing page speed, test redirects on iPhone and Android, verify analytics events, confirm parameters, and scan from a printed proof at intended size and viewing distance.
Choosing metrics that actually reflect performance
Many teams focus on scan volume because it is visible and easy to report. Scan volume is useful, but it is not enough. A high-scan campaign with low engagement can be weaker than a lower-scan campaign that produces qualified conversions. The core metric set should usually include scans, unique visitors, landing page engagement, conversion rate, cost per conversion, and assisted revenue when available. For local campaigns, add location-specific comparisons. For time-sensitive activations, measure scans by hour or daypart. For packaging, track repeat scans to understand post-purchase behavior.
It helps to separate interaction metrics from outcome metrics. Interaction metrics show that the physical creative motivated action: scan rate, unique scans, repeat scans, device type, time to scan, and bounce rate. Outcome metrics show business impact: purchases, leads, registrations, calls, bookings, or downloads. If a billboard receives few scans but those scans convert at a high rate, the issue may be creative visibility rather than offer relevance. If a flyer receives many scans but no conversions, the problem may be landing page mismatch, weak incentive, or poor audience targeting.
| Metric | What it tells you | Best use case |
|---|---|---|
| Total scans | Overall response volume from a placement or asset | Top-line campaign monitoring |
| Unique scans | Approximate number of distinct visitors | Comparing reach across locations |
| Conversion rate | How effectively the landing experience turns interest into action | Evaluating offer and page quality |
| Cost per conversion | Efficiency of media and production spend | Budget allocation decisions |
| Repeat scan rate | Whether people return after initial interaction | Packaging, loyalty, and support journeys |
One nuance marketers often miss is that scans are not impressions. A code on a transit poster may be seen by thousands and scanned by dozens. That does not mean the poster failed; it means QR scans measure active response, not total exposure. To estimate broader performance, pair scan data with placement-level impression estimates from media owners, retail traffic counts, or event attendance. Then you can model response rate by exposure while still using scans as the verifiable action signal.
Tools, platforms, and analytics integration
The most effective QR tracking stacks combine a code management platform with web analytics and, when relevant, a CRM or commerce system. Common QR platforms include Bitly, QR Code Generator PRO, Beaconstac, Flowcode, and Uniqode. These tools typically support dynamic codes, scan analytics, bulk generation, and branded short domains. On the analytics side, Google Analytics 4 remains the default for session and conversion tracking, while Adobe Analytics is common in enterprise environments. For lead generation, HubSpot, Salesforce, or Marketo can capture downstream attribution beyond the initial scan.
In implementation, use a branded short domain whenever possible. A redirect such as go.brand.com feels more trustworthy than an unfamiliar shared domain, and it gives you more control if you later migrate vendors. Configure server-side redirects carefully, preferably with 302 or platform-managed routing during active testing, then maintain stable behavior after launch. Make sure campaign parameters persist to the final URL, and verify that consent management tools do not strip attribution unexpectedly. If your organization uses cross-domain journeys, validate that session continuity survives the redirect chain.
For advanced reporting, connect QR campaign data to a dashboard in Looker Studio, Tableau, or Power BI. A useful dashboard shows scans by campaign, location, asset type, date range, and conversion outcome. I also recommend storing a unique asset ID outside the visible UTM set. This allows granular analysis even when public parameters stay clean. In one retail program, this made it possible to identify that endcap signage in suburban stores produced twice the conversion rate of aisle signage, despite similar scan counts, because the shopper intent at those touchpoints was different.
Placement strategy, creative execution, and scan context
Where and how a QR code appears determines whether the tracking data is meaningful. A code placed too high on a poster, too small on a shelf tag, or too close to a window glare source will underperform regardless of offer quality. Best practice is practical, not decorative: sufficient quiet zone around the code, strong contrast, adequate print resolution, and size matched to scanning distance. A common field rule is roughly one inch of code size for every ten inches of scanning distance, though environmental factors can require larger execution.
Context matters just as much as technical readability. Users need a reason to scan and confidence about what happens next. Clear calls to action outperform generic language. “Scan to see today’s menu” is stronger than “Scan me.” “Scan for 20% off your first order” sets expectation better than a bare code on packaging. The best offline campaigns reduce cognitive friction by aligning message, moment, and destination. At a trade show, a code promising a spec sheet or instant demo request fits the attendee mindset. On a product package, setup help, refill ordering, or loyalty enrollment often perform better than a generic homepage link.
Scan context also affects data quality. A code in a subway station may attract hurried users on poor connectivity. A code on direct mail is scanned in a quieter environment with higher intent. A code on restaurant takeaway packaging may be scanned hours after purchase. These differences shape bounce rate, time on site, and conversion lag. That is why comparison should be like-for-like whenever possible. Evaluate store posters against other store posters, not against nurture-oriented packaging inserts serving a different user state.
Attribution limits, testing methods, and optimization cycles
QR codes improve offline attribution, but they do not create perfect causality. Some people see a poster and later search the brand name instead of scanning. Others scan on one device and convert later on another. Privacy controls, ad blockers, cookie consent choices, and app browser behavior can also reduce visibility. The right approach is to treat QR data as a strong directional signal paired with other evidence, not as the only truth source. This is especially important when senior stakeholders expect exact offline return on ad spend from channels that influence behavior indirectly.
Testing helps close that gap. The simplest method is creative A/B testing with distinct codes tied to matched placements or audiences. You can test CTA language, incentive, landing page structure, or design prominence. Geographic holdout testing is also effective: run QR-enabled signage in one region and compare lift in tracked visits or conversions against a similar control region. For direct mail, version codes by audience segment or offer type. For in-store programs, compare departments, entry points, or cashier prompts. The key is isolating one meaningful variable at a time so results are interpretable.
Optimization should follow a regular loop. Review performance weekly for active campaigns and monthly for ongoing assets like packaging or evergreen signage. Retire underperforming destinations, improve landing page speed, adjust CTA wording, and update redirects when promotions expire. If scan rates are low, inspect physical placement before rewriting the offer. If scans are healthy but conversions lag, audit the mobile journey, form fields, page load time, and trust signals. In my experience, the largest gains often come from post-scan improvements, not from changing the code design itself. A faster page and a clearer benefit statement can double conversion rate without reprinting anything.
Tracking offline campaigns with QR codes works best when marketers treat physical media as a measurable entry point into a broader digital journey. The code is not the strategy. The strategy is the combination of disciplined naming conventions, dynamic redirects, analytics integration, conversion tracking, and creative choices that give people a compelling reason to scan. When those pieces are aligned, QR campaigns reveal which placements, messages, and moments actually move customers from awareness to action.
The strongest programs share the same habits: they define success before launch, generate unique codes for each asset, use dynamic management, connect scans to web and CRM outcomes, and review performance on a steady optimization cycle. They also respect the limitations of attribution. A scan is a verified interaction, not a full picture of every influence. Pairing scan data with placement context, impression estimates, and conversion outcomes produces much better decisions than relying on any single metric alone.
For teams building a QR Code Marketing & Strategy program, this page should serve as the hub for tracking and analytics. Use it to standardize your framework, then apply those standards across packaging, direct mail, retail, events, and out-of-home media. Start with one campaign, instrument it carefully, and compare placements with clean data. Once you can trust the measurement, you can scale budget with confidence and make offline marketing perform like a channel you can truly manage.
Frequently Asked Questions
How do QR codes help track offline marketing campaigns more accurately?
QR codes make offline campaigns measurable by giving each physical placement its own scannable path to a digital destination. Instead of sending every poster, mailer, shelf talker, package insert, or event banner to the same generic website URL, marketers can assign a unique QR code to each channel, store, region, creative version, or promotion period. When someone scans that code with a smartphone, the visit is logged just like other digital traffic, which means teams can see which offline asset generated the visit, when it happened, and what happened next on the website or landing page.
This matters because offline marketing has historically been difficult to attribute with confidence. A person might see a sign in-store, remember the brand later, and visit the site directly, which creates ambiguity. A QR code reduces that ambiguity by prompting immediate action at the point of exposure. It creates a much cleaner measurement trail between physical media and digital behavior. In practical retail implementations, this can be especially useful for comparing store signage performance, product packaging engagement, seasonal endcap displays, or local event activations. Rather than relying on assumptions, teams can review scan volume, sessions, conversions, bounce rate, and other engagement metrics tied to a specific code.
Used correctly, QR codes also support more advanced attribution. By pairing each code with campaign-specific landing pages or tagged URLs, marketers can identify not just that a scan occurred, but which campaign, audience segment, or location drove the action. That makes QR tracking valuable for budget decisions, creative testing, and operational planning. The result is not perfect measurement of every offline impression, but it is a significant upgrade from guesswork and one of the most practical ways to connect physical marketing exposure to observable digital outcomes.
What is the best way to set up QR codes for posters, packaging, mailers, and in-store displays?
The best setup starts with structure and consistency. Before generating any QR code, define what you want to measure. That usually means deciding whether you need to track by channel, individual placement, store location, product line, campaign wave, or creative variant. Once that framework is clear, create a naming convention for destinations and tracking parameters so every code maps cleanly to your reporting. For example, a retail team might distinguish between window signage, aisle displays, product packaging, direct mail, and event materials, then break those categories down further by geography or promotion.
From there, create destination URLs that include campaign tracking parameters, typically UTM tags, so analytics platforms can identify source, medium, campaign, content, and sometimes term. This is what turns a scan into attributable traffic inside analytics tools. Many teams also use dynamic QR codes rather than static ones. A dynamic code points to a redirect service, which allows you to update the destination later without reprinting the physical asset. That is especially helpful for packaging, long-running signage, and materials with a long shelf life. If an offer changes, a landing page moves, or a campaign needs to be extended, the code can remain the same while the destination updates behind the scenes.
Physical execution matters just as much as digital setup. The code should be large enough to scan easily, placed where lighting and viewing angle support quick use, and paired with a clear call to action that explains why someone should scan. “Scan to view styles,” “Scan for setup instructions,” or “Scan for a limited-time offer” generally performs better than a code with no context. In stores, placement near decision points often works well. On packaging, the experience should align with post-purchase or product education needs. On direct mail, the code should reinforce the primary message rather than act as an afterthought. A well-configured QR campaign is not just trackable; it is also convenient and compelling for the person holding the phone.
What metrics should marketing teams pay attention to after launching a QR code campaign?
The most obvious metric is scan volume, but it should never be the only one. A high number of scans can look impressive while still delivering weak business results if the traffic does not engage or convert. Strong QR reporting should include scans, unique users or sessions, landing page engagement, conversion rate, time on page, bounce or exit behavior, and any downstream actions such as form submissions, coupon redemptions, add-to-cart activity, or purchases. For retail and omnichannel teams, it can also be useful to compare scans against store traffic, inventory timing, promotional periods, or localized campaign rollout schedules.
Context is critical when evaluating performance. For example, packaging QR codes may generate fewer scans than event signage, but those scans may come from existing customers who are deeper into the buying journey and more likely to convert. In-store display codes might produce strong scan rates during weekends or peak shopping hours, while direct mail codes may show delayed response patterns over several days. Looking at metrics by location, audience segment, creative treatment, and time period helps uncover patterns that broad aggregate reporting can hide.
Another important distinction is between scan performance and landing page performance. If a code is getting scanned but users drop off quickly, the issue may not be the physical campaign at all. It could be a mismatch between the call to action and the destination experience, a page that loads too slowly on mobile, or an offer that feels irrelevant once the user arrives. Conversely, if engagement is strong but scan volume is low, the placement, size, visibility, or messaging around the QR code may need improvement. The best teams treat QR reporting as a full funnel measurement system, not just a scan count dashboard.
Are dynamic QR codes better than static QR codes for offline campaign tracking?
In most marketing situations, yes. Dynamic QR codes are usually the better choice because they offer flexibility, easier management, and stronger tracking options. A static QR code directly encodes the final destination URL, which means the code itself cannot be changed once printed. If the landing page breaks, the campaign changes, or the offer expires, the printed asset becomes harder to salvage. A dynamic QR code, by contrast, sends the user through a redirect that can be updated at any time. That allows marketers to keep the same printed code live while changing the final destination, preserving materials that may already be distributed across stores, mail pieces, product packaging, or event installations.
Dynamic codes are also helpful when campaigns evolve. A retail brand might start with a promotional landing page, then later redirect the same code to a broader category page, store locator, loyalty signup, or seasonal collection. This makes them ideal for long-term physical assets and environments where reprinting is expensive or logistically difficult. They also support cleaner performance monitoring because scans can be recorded centrally before users reach the final destination, which gives marketers another layer of visibility into campaign activity.
That said, static QR codes still have a place. If the destination is permanent, the campaign is simple, and there is no need for ongoing updates, a static code can work perfectly well. They can be appropriate for evergreen content such as product documentation, contact pages, or stable informational resources. The decision usually comes down to lifespan and measurement needs. For most offline marketing campaigns where attribution, optimization, and flexibility matter, dynamic QR codes provide far more control and reduce the risk of wasted print production.
What are the most common mistakes to avoid when using QR codes in offline campaigns?
One of the biggest mistakes is treating the QR code as the strategy instead of the tool. A QR code by itself does not create engagement; the surrounding message, offer, placement, and user experience do that. If the code appears on a poster or display with no clear reason to scan, response will usually be weak. People need immediate value and simple direction. A strong call to action, a relevant destination, and a mobile-friendly landing page are essential. If any of those elements are missing, measurement may still exist, but performance will disappoint.
Another common issue is poor campaign structure. When teams reuse the same QR code across every store, mailer, sign, and package, they lose the ability to compare performance meaningfully. The code may still drive traffic, but attribution becomes too broad to support optimization. Similarly, inconsistent or missing UTM parameters can create reporting gaps that make results harder to interpret. QR tracking works best when there is a deliberate system behind code creation, naming, tagging, and reporting.
Execution mistakes also matter. Codes that are too small, placed too high, printed with low contrast, distorted by design treatments, or positioned in poor lighting can dramatically reduce scan success. In retail settings, I have seen performance improve simply by moving a code closer to natural stopping points or by pairing it with clearer benefit-driven copy. Teams should also test every code before production and after installation, on multiple devices and network conditions. Finally, do not ignore the post-scan experience. If the landing page loads slowly, is not optimized for mobile, or fails to match the promise on the printed material, the campaign loses momentum immediately. The most successful QR programs combine solid tracking infrastructure with thoughtful real-world usability.