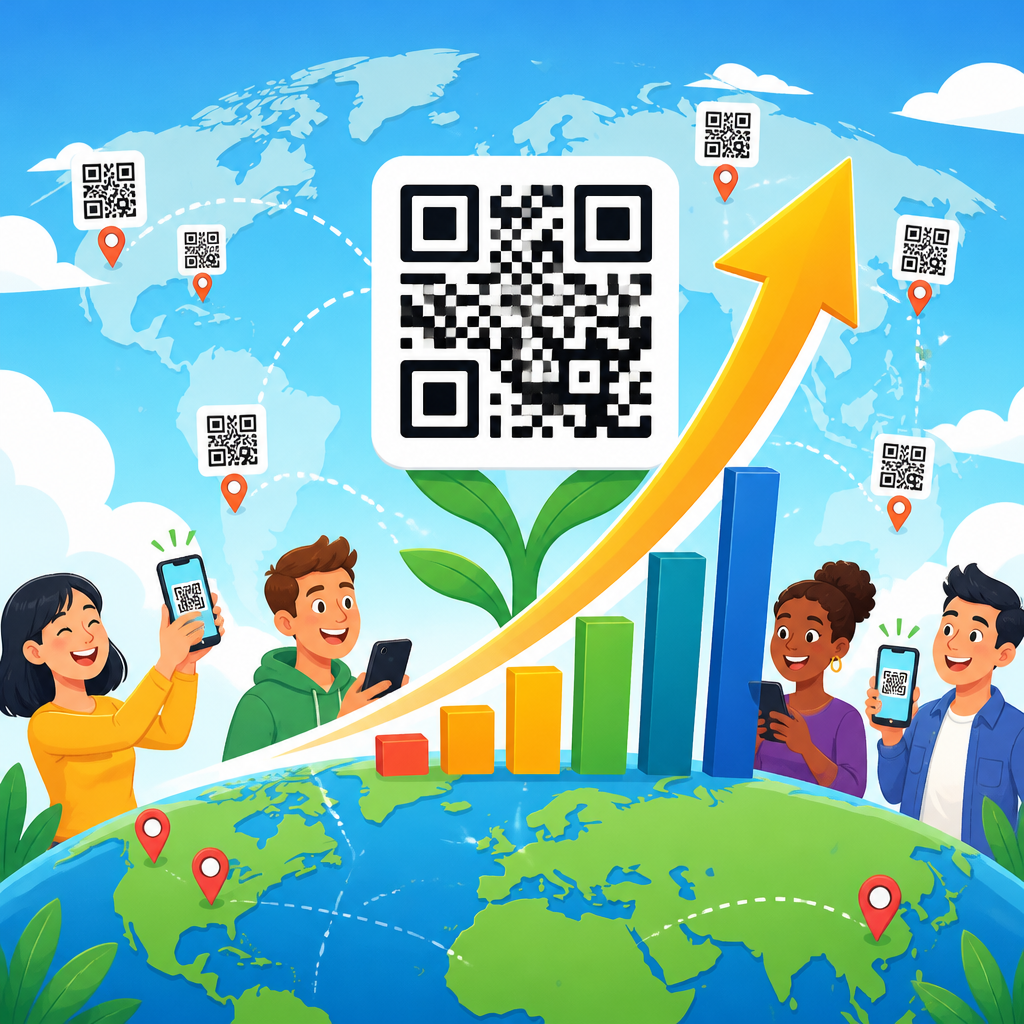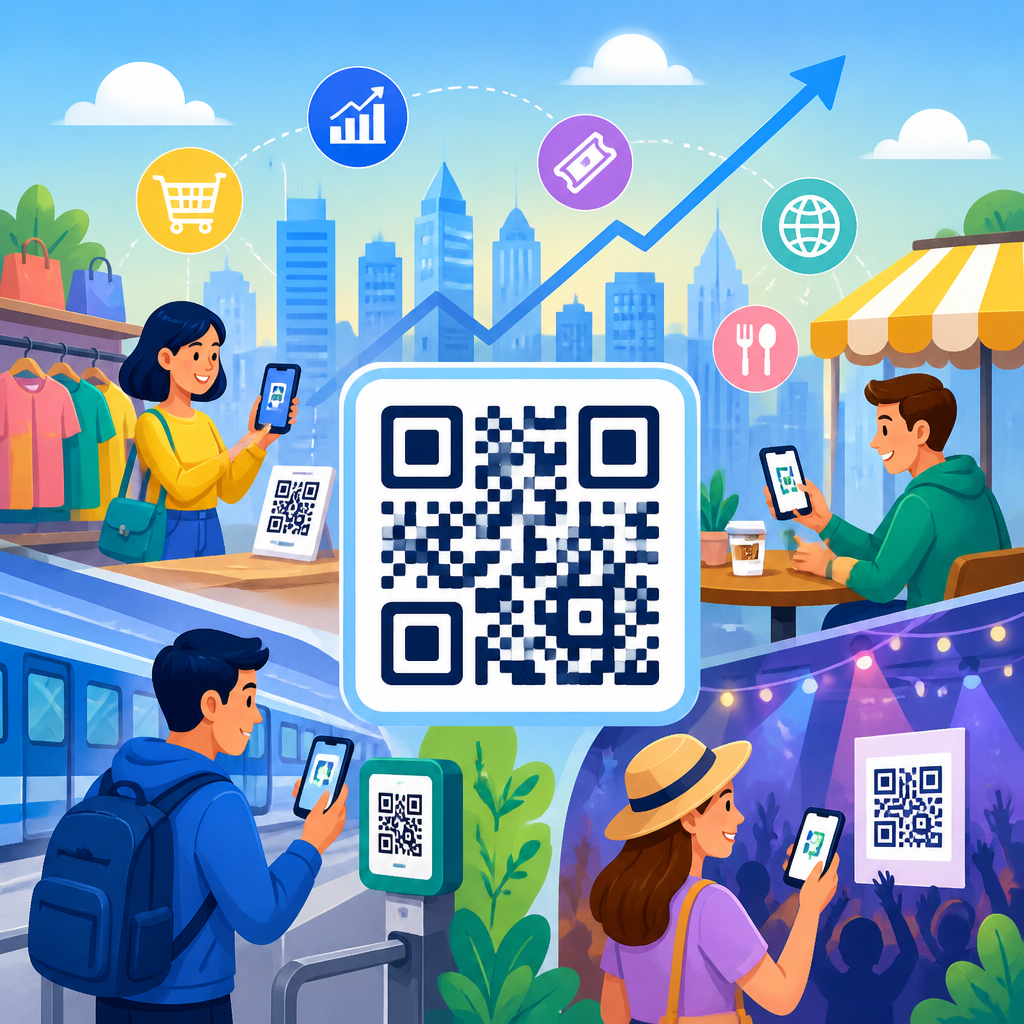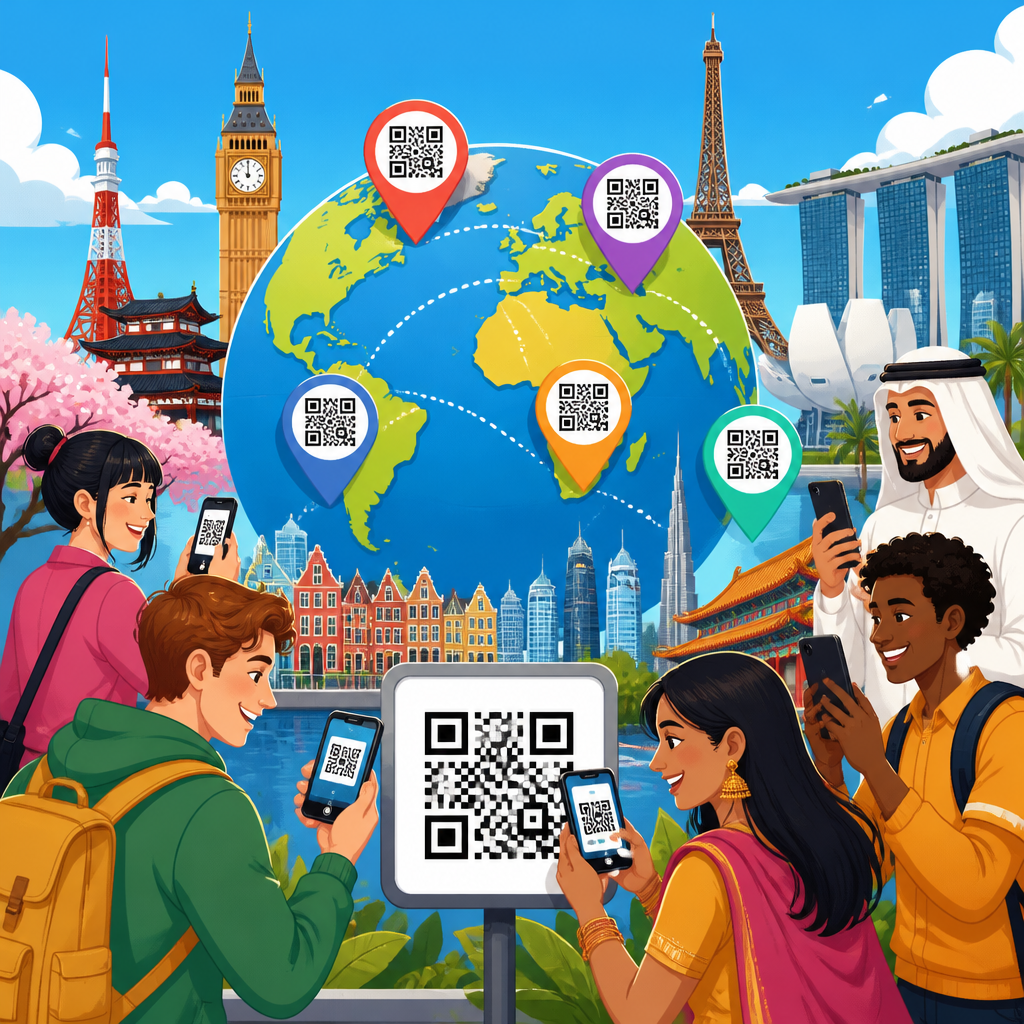
QR code usage statistics show how a once niche barcode format became a mainstream bridge between physical and digital experiences across payments, marketing, logistics, healthcare, and public services. A QR code, short for Quick Response code, is a two dimensional matrix barcode invented by Denso Wave in 1994 to store more data than a traditional linear barcode and to be read quickly by scanners or smartphone cameras. In practical terms, global QR code adoption trends measure how often consumers scan codes, how many businesses deploy them, which industries rely on them, and how market demand shifts by region, device ecosystem, and use case. This matters because QR codes now sit at the center of customer acquisition, contactless commerce, authentication, ticketing, and product traceability. In my work with digital campaigns and mobile conversion funnels, I have seen QR performance move from experimental to foundational: brands that once printed a static code on packaging now connect dynamic codes to analytics dashboards, localized landing pages, and first party data capture. The market overview is no longer just about scan volume; it is about infrastructure maturity, consumer trust, interoperability, and measurable return. Understanding the numbers behind adoption helps retailers plan omnichannel experiences, helps payment providers prioritize standards, and helps publishers interpret why smartphone based access patterns continue to reshape offline media. It also provides a baseline for deeper articles on payments, packaging, restaurant ordering, security, and regional trends across the broader QR Code Trends and Innovations hub.
Global QR code adoption accelerated because three forces aligned at the same time: nearly universal smartphone camera access, widespread mobile internet, and a post pandemic preference for low friction, contactless interactions. Apple’s addition of native QR recognition in iOS Camera and Google’s support through Android camera apps removed the need for separate scanner apps for most users. That change was critical. Friction kills scan rates, and when scanning became a default phone behavior, codes became usable at scale. The result is a market that spans mature payment ecosystems in China and India, rapid merchant adoption in Southeast Asia, growing engagement in North America and Europe, and expanding utility in manufacturing and public administration worldwide. The statistics are meaningful only when read in context. A scan on a restaurant menu, a cross border wallet payment, and a serialized package authentication event all count as QR interactions, yet they reflect different kinds of demand. A solid global market overview therefore looks beyond headline growth and breaks adoption into consumer behavior, enterprise deployment, standards, and monetization. That broader view shows why QR codes remain durable rather than temporary. They are cheap to print, flexible to update when dynamic, and compatible with almost any object or screen.
Global market size and core adoption drivers
The global QR code market is best understood as a combination of software platforms, code generation and management tools, payment rails, scanning behavior, and industry specific deployment. Analysts regularly project strong growth for QR related software and payment volume through the decade, though exact figures vary by methodology because some studies count only code management platforms while others include QR payments or industrial labeling systems. The common conclusion is consistent: usage is expanding across both consumer and enterprise channels. In campaign reporting I have reviewed, dynamic QR campaigns often outperform vanity URLs in offline environments because a camera scan reduces typing errors and shortens the path to action. That advantage becomes especially visible on packaging, out of home advertising, event signage, and direct mail.
Several structural drivers explain the market’s expansion. First, implementation cost is low. A business can create a static code in minutes, and larger organizations can deploy dynamic codes with analytics, redirects, and expiration controls at modest software cost. Second, interoperability is improving. EMVCo specifications for merchant presented QR payments, GS1 Digital Link for product identification, and national payment standards in markets such as India help reduce fragmentation. Third, marketers value measurability. A printed poster historically offered weak attribution; a dynamic QR code tied to UTM parameters, device data, and geographic reporting turns offline media into a trackable digital touchpoint. Fourth, operational teams use QR codes for inventory, maintenance, onboarding, and document access because they reduce lookup time and training overhead. These are not theoretical gains. Warehouses use codes to link bins to cloud records, hospitals use them to connect patient wristbands and medication workflows, and utilities use them on field assets to surface service histories instantly.
Regional patterns in global QR code adoption trends
Regional differences define the global QR landscape. China remains the clearest example of large scale normalization, where Alipay and WeChat Pay turned QR payments into everyday infrastructure across street vendors, transit, retail, and peer to peer transfers. The significance is not only volume but habit formation: consumers expect to scan and pay, scan and follow, or scan and authenticate. India represents another major adoption engine, driven by the Unified Payments Interface and interoperable QR acceptance for merchants of all sizes. UPI QR payments lowered barriers for small businesses because a printed code could replace expensive point of sale hardware. That shifted digital acceptance from organized retail into neighborhood commerce at extraordinary speed.
Southeast Asia shows similar momentum, with national schemes and super apps promoting merchant QR payments and cross border compatibility. Singapore’s SGQR initiative, Thailand’s PromptPay, and regional wallet ecosystems demonstrate how standardization supports scale. In Europe, adoption is more fragmented, but strong use cases exist in transport, restaurant ordering, product information, and invoice payments. European growth also reflects regulatory and consumer interest in product traceability, where QR codes can surface sustainability details or digital product passports. North America started from a lower consumer payment baseline, yet saw major gains in menus, mobile engagement, event ticketing, and retail packaging. The United States and Canada now use QR codes heavily in marketing, authentication, and service workflows, even if card based tap to pay remains stronger for point of sale payments than in Asia.
| Region | Primary adoption pattern | Leading use cases | Main growth constraint |
|---|---|---|---|
| China | Mature daily use | Wallet payments, super apps, commerce | Market saturation in core urban segments |
| India | Explosive merchant acceptance | UPI payments, microbusiness transactions | Connectivity and fraud awareness gaps |
| Southeast Asia | Fast regional expansion | Wallet payments, tourism, cross border retail | Uneven interoperability by country |
| Europe | Steady practical adoption | Transport, product info, hospitality | Consumer habit fragmentation |
| North America | Marketing led mainstreaming | Menus, packaging, tickets, promotions | Payment use less dominant than cards |
Consumer scanning behavior and device ecosystem shifts
Consumer behavior explains why QR code usage statistics can rise even when payment shares differ by market. The simplest change was device readiness. Once smartphone camera apps automatically recognized QR codes, scan intent no longer depended on installing a dedicated app. That increased casual scanning, especially in moments where users had little patience, such as transit entrances, product shelves, or restaurant tables. Scan rates also improved because brands learned basic execution rules: larger quiet zones, stronger contrast, clear calls to action, and mobile optimized landing pages. A code that says “Scan to view ingredients” or “Scan to claim 10% off” consistently performs better than an unlabeled square.
Consumer trust remains decisive. People scan when the destination feels useful and safe. This is why reputable brands, HTTPS destinations, branded short links, and transparent value exchange matter. In projects I have audited, poor post scan experiences, not the code itself, usually caused underperformance. A slow landing page, forced app download, or irrelevant destination can cut conversion sharply. By contrast, a dynamic code that routes users by device language, location, or inventory status can raise engagement because it respects context. Demographics matter too, but less than many assume. Younger users scan more often for social, payment, and event experiences, while older users adopt quickly when the task is practical, such as accessing a menu, paying a bill, or verifying a medicine package. The broader trend is clear: scanning is no longer novel behavior. It is an established mobile input method.
Industry use cases shaping market demand
Different industries contribute different kinds of volume to the QR market. Retail and consumer packaged goods use QR codes on shelves and packaging to connect shoppers with nutrition data, promotions, loyalty enrollment, how to content, recycling instructions, and authenticity checks. Here, the next wave is linked to GS1 Digital Link, which can connect a single product identifier to multiple digital experiences while supporting eventual transition from classic barcodes to richer consumer and supply chain functions. Restaurants and hospitality rely on codes for menus, ordering, payment, reviews, and guest services. Event organizers use them for registration, mobile ticketing, access control, and sponsor activations.
Healthcare has expanded carefully but meaningfully. Hospitals and pharmacies use QR codes for patient identification, medication administration support, appointment check in, and educational materials. The stakes are higher here, so governance, printing quality, and privacy safeguards matter more than in a marketing campaign. Manufacturing and logistics use QR codes alongside Data Matrix and other machine readable labels for asset tracking, maintenance instructions, and work order retrieval. Governments use them for forms, tax payments, permits, identity linked services, and public information. Education uses them in classrooms, libraries, and campus access. These examples explain why global QR code adoption trends are resilient. Demand does not depend on one industry. It is distributed across sectors with different investment cycles and different definitions of value, from scan conversion to labor savings to fraud reduction.
Payments, standards, and interoperability
QR payments deserve separate attention because they account for some of the largest transaction volumes in the market. Merchant presented QR works by displaying a code the customer scans to initiate payment, while customer presented QR reverses the flow and lets the merchant scan the shopper’s code. The model succeeds where it lowers hardware costs, supports instant account to account transfers, and integrates with existing banking or wallet behavior. India’s UPI is the clearest proof point. Interoperable QR acceptance gave even the smallest merchant a low cost path into digital payments and transformed person to merchant transactions at national scale.
Standards determine whether growth compounds or stalls. EMVCo QR specifications improved consistency for payment acceptance, reducing the chaos of proprietary approaches. GS1 standards matter for product identification and digital link resolution. ISO and sector specific labeling standards shape industrial and healthcare use. Interoperability is not just a technical issue; it influences merchant confidence and consumer habit. If one code works across multiple banking apps or wallets, acceptance rises. If each program needs a separate code and separate training, adoption slows. Security also matters. Static payment codes are simple but can be replaced or tampered with if merchants do not monitor them. Dynamic systems reduce some risks by generating transaction specific data, but they add platform dependency and operational complexity. The strongest implementations balance usability, fraud controls, and fallback processes.
What businesses should track next
For companies planning around global QR code adoption trends, the most useful statistics are not vanity scan totals. Track unique scans, repeat scans, scan to conversion rate, landing page load time, device split, geography, and assisted revenue. Separate static informational use cases from transactional ones, because success benchmarks differ. A package authentication flow may prioritize trust and completion rate, while an out of home campaign may prioritize incremental traffic and store visits. Also watch print placement, code size, and destination relevance, because execution details often explain performance better than market averages.
The main takeaway from today’s QR code usage statistics is that the technology has matured into durable infrastructure for mobile access, contactless transactions, and connected products. Global adoption is broad, but not uniform: Asia leads in payment normalization, North America excels in marketing and service workflows, Europe advances through practical utility and traceability, and emerging markets continue to benefit from low deployment cost. The lasting benefit is flexibility. A single well managed QR strategy can support acquisition, payments, support, and compliance across channels. Businesses that treat QR codes as measurable digital entry points rather than decorative add ons will capture the most value. Use this hub as your starting point, then map the regional, payment, packaging, and security topics most relevant to your organization’s next rollout.
Frequently Asked Questions
1. What do QR code usage statistics reveal about global adoption trends?
QR code usage statistics show that QR technology has moved far beyond its original industrial purpose and is now part of everyday digital behavior in many countries. What was once primarily used in manufacturing and inventory systems has become a mainstream tool for payments, product information, ticketing, authentication, customer engagement, healthcare workflows, and public services. The biggest takeaway from global adoption data is that QR codes succeed because they reduce friction: users can scan with a smartphone camera and instantly reach a payment screen, website, app download, digital menu, form, or verification page without typing a URL or installing special hardware.
At a market level, adoption trends also reveal that usage is not limited to one region or one industry. In Asia, QR codes became deeply embedded in mobile payment ecosystems and everyday commerce. In North America and Europe, adoption accelerated through restaurant menus, retail promotions, event access, contactless interactions, and omnichannel marketing. In emerging markets, QR codes are often especially valuable because they provide a low cost way to connect offline consumers with digital services. This makes them attractive for banks, retailers, transit systems, healthcare organizations, government agencies, and logistics providers alike.
Another important insight from usage statistics is that the QR code market is driven by convenience, smartphone penetration, and software integration. As more consumers use camera-enabled phones and as businesses deploy cloud-based QR management tools, scanning becomes easier and use cases multiply. The result is a steady shift from static, one-time QR implementations to dynamic, trackable, and data-rich campaigns that support analytics, personalization, and ongoing customer communication. In short, global QR code usage statistics reflect the broader digitization of physical environments and the growing need to connect real-world touchpoints with online actions.
2. Why did QR codes become so popular across industries after being invented in 1994?
QR codes became widely popular because the technology solves a simple but powerful problem: how to move someone from a physical object or location into a digital experience in one quick action. Invented by Denso Wave in 1994, the QR code was designed to hold more information than a traditional one-dimensional barcode and to be scanned quickly from multiple angles. Those technical advantages mattered in industrial settings first, but the true global expansion happened when smartphones turned millions of people into instant QR scanners.
Several factors explain the surge in popularity across industries. First, QR codes are inexpensive to create and deploy. A business can place one on packaging, posters, receipts, tables, mailers, invoices, product labels, storefront windows, or shipping documents with very little added cost. Second, QR codes are highly versatile. A single scan can trigger a wide range of actions, from opening a website or payment page to downloading an app, verifying a product, checking into an event, or viewing medical and logistics data. Third, they support contactless interaction, which became especially important when businesses and public institutions looked for safer, low-touch ways to serve customers and citizens.
The rise of analytics has also contributed to their popularity. Modern QR code platforms allow organizations to measure scan volume, location, device type, time of engagement, and campaign performance. That makes QR codes far more than a convenience feature; they become a measurable marketing, operations, and customer service tool. Add in broad consumer familiarity, improved mobile camera recognition, and the ability to update dynamic QR destinations without changing the printed code, and it becomes clear why industries from retail and finance to healthcare and government embraced them so quickly. Their popularity is really the result of utility, affordability, scalability, and strong alignment with mobile-first behavior.
3. Which industries are driving the strongest growth in QR code usage worldwide?
Several industries are leading global QR code growth, and each is using the technology in a slightly different way. Payments is one of the most important sectors. In many markets, QR codes have become a standard method for person-to-business and person-to-person transactions, allowing consumers to pay quickly with mobile wallets or banking apps. This has been especially transformative in regions where mobile payment adoption outpaced traditional card infrastructure, but even mature payment markets now use QR codes for checkout, billing, tipping, and digital invoicing.
Retail and marketing are also major growth engines. Brands use QR codes on packaging, shelf displays, print advertising, direct mail, and in-store signage to connect shoppers with product details, reviews, promotions, loyalty programs, and post-purchase support. Because the codes can bridge physical media and digital analytics, they are particularly useful in omnichannel commerce strategies. Restaurants and hospitality businesses have also played a large role in normalizing QR interactions through digital menus, table ordering, reservations, guest services, and feedback collection.
Logistics and supply chain operations continue to be a foundational use case. QR codes support item tracking, warehouse efficiency, shipment verification, maintenance records, and asset management. In healthcare, they are used for patient identification, medication tracking, lab workflows, vaccination records, appointment check-ins, and access to educational materials. Public sector organizations increasingly use them for transit passes, utility payments, forms, public notices, tourism information, and digital government services. Events and entertainment are another strong area, with QR codes supporting ticketing, venue access, concessions, and fan engagement. Taken together, these industries show that QR growth is strongest wherever organizations need a fast, low-cost, scannable link between physical environments and digital systems.
4. How do businesses use QR code statistics to measure performance and improve strategy?
Businesses use QR code statistics as a practical decision-making tool, not just as a novelty metric. At the most basic level, scan volume tells a company whether people are engaging with a code at all. But more advanced performance analysis goes much deeper. Organizations often track total scans, unique scans, repeat scans, device type, time of day, geographic location, conversion rates, landing page behavior, and downstream actions such as purchases, sign-ups, bookings, app installs, or form submissions. This helps businesses evaluate whether a QR code is simply being noticed or whether it is actually producing meaningful commercial or operational results.
These insights can directly improve strategy. For example, a retailer can compare scan rates across packaging designs, shelf placements, or promotional messages to identify what drives stronger engagement. A restaurant can analyze menu scans by time and location to optimize staffing, pricing, or featured items. A logistics company can use scan data to monitor process compliance, delivery confirmation, and handoff efficiency. In healthcare or public administration, scan activity can help track how effectively digital resources are being accessed by patients or citizens.
QR statistics are also useful for testing and optimization. Businesses can run A/B experiments with different call-to-action wording, code size, color contrast, placement, and landing page design to improve performance over time. Dynamic QR codes are especially valuable because they allow the destination content to be updated without reprinting the code, making campaigns more agile and cost-effective. When paired with broader analytics platforms, QR data helps organizations connect offline touchpoints to online outcomes, which is often one of the hardest parts of measuring physical-world marketing and service interactions. In that sense, QR code statistics provide both visibility and accountability across customer experience, operations, and revenue generation.
5. What factors will shape the future of the global QR code market?
The future of the global QR code market will be shaped by a combination of consumer behavior, mobile technology, business digitization, and trust. One of the biggest long-term growth drivers is the continued blending of physical and digital experiences. As companies invest more heavily in connected packaging, smart retail, contactless payments, self-service transactions, and omnichannel engagement, QR codes offer a simple and scalable interface that works across many environments. Their low implementation cost means they are likely to remain attractive even as newer technologies emerge.
Another important factor is software sophistication. The market is moving beyond basic static codes toward dynamic QR systems with analytics, content personalization, security controls, and integrations with customer relationship management, payment, inventory, and marketing automation platforms. This evolution makes QR codes more valuable to enterprises because they are no longer just links; they become trackable infrastructure for communication, authentication, and workflow management. As a result, future market growth will likely be supported not only by scan volume but by the expanding business intelligence and process value behind each scan.
Security and user trust will also play a central role. As QR usage increases, so does awareness of phishing, malicious redirects, and counterfeit code placement. Organizations that adopt clear branding, secure destinations, verified payments, and transparent user experiences will be better positioned to maintain consumer confidence. At the same time, improvements in mobile operating systems, browser warnings, and enterprise governance can help reduce misuse. Looking ahead, the global QR code market is likely to grow strongest where convenience, interoperability, analytics, and trust come together. That is why QR codes are increasingly seen not as a temporary trend, but as a durable layer of digital access across commerce, services, and everyday life.