QR code data density explains how much information a symbol can store within a limited grid while still remaining scannable in real conditions. In practice, data density is shaped by the QR Code standard, the data mode being used, the selected version, the error correction level, and the print or display environment. I have worked with QR implementations for packaging, tickets, industrial labels, and mobile onboarding flows, and the same lesson appears every time: a code that is technically valid can still fail if its density is pushed beyond what cameras, substrates, and users can tolerate. Understanding QR Code standards and formats is therefore not just a matter of specification literacy. It directly affects scan speed, reliability, visual size, production cost, and user trust.
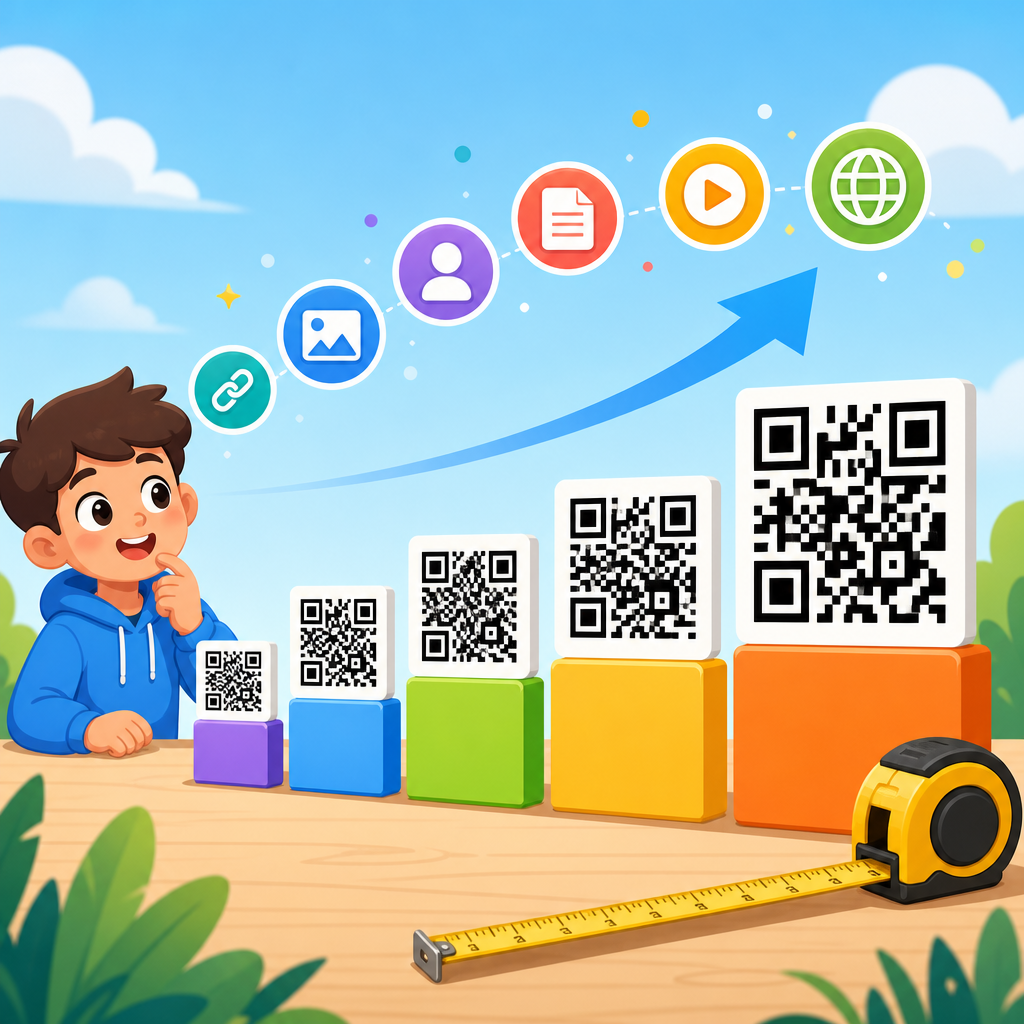
A QR Code is a two-dimensional matrix symbol standardized through ISO/IEC 18004. Unlike a one-dimensional barcode, which stores data along a single axis, a QR symbol uses rows and columns of modules, the small square cells that make up the pattern. Data density refers to the relationship between the amount of encoded information and the physical or logical space required to encode it. Higher density means more data in the same footprint, but it also means smaller modules, tighter tolerance, and less resilience to poor lighting, motion blur, low contrast, or print defects. That tradeoff is at the center of every standards and format decision.
This topic matters because teams often choose a QR format by habit instead of by payload design. A marketing team may paste a long URL with tracking parameters into a default generator. A manufacturer may encode alphanumeric serials without checking whether byte mode is being forced. A designer may add a logo and increase error correction without realizing that the symbol version will jump, making labels too small to print cleanly. When you understand standards and formats comprehensively, you can reduce symbol size, improve first-scan success, and build a more durable system. This hub covers the major concepts, from symbol structure to mode selection, version sizing, error correction, variants, and implementation rules.
How QR Code standards define capacity and structure
The QR Code standard defines a fixed architecture, and that architecture determines data density before you even enter the payload. Every symbol contains finder patterns in three corners, timing patterns, alignment patterns in larger versions, format information, version information for versions 7 and above, quiet zone requirements, and the encoded data plus error correction codewords. These functional patterns consume space that cannot hold user data. As a result, larger symbols do not scale linearly in useful capacity. They gain room, but some of that room is always reserved for structure and recovery.
Versions are the first capacity lever. Standard Model 2 QR Codes range from Version 1 at 21 by 21 modules to Version 40 at 177 by 177 modules, increasing by four modules per side per version. Micro QR offers smaller versions for constrained applications, while rMQR and iQR expand format options in specific environments. In practical work, I start with the smallest version that fits the payload at the required error correction level, then verify the resulting module size against the minimum print or display conditions. The standard may allow the data, but the environment decides whether the code performs.
Capacity also depends on mask patterns and Reed-Solomon error correction. The standard uses masking to avoid problematic visual patterns that interfere with scanning, and it uses block-based error correction so damaged modules can be reconstructed. Both mechanisms improve readability, but neither is free. Error correction consumes codewords that could otherwise carry payload data. This is why capacity charts always show different maximums for levels L, M, Q, and H. Higher resilience means lower net payload, and the density decision becomes a business choice about risk tolerance.
Data modes: the biggest hidden driver of QR Code data density
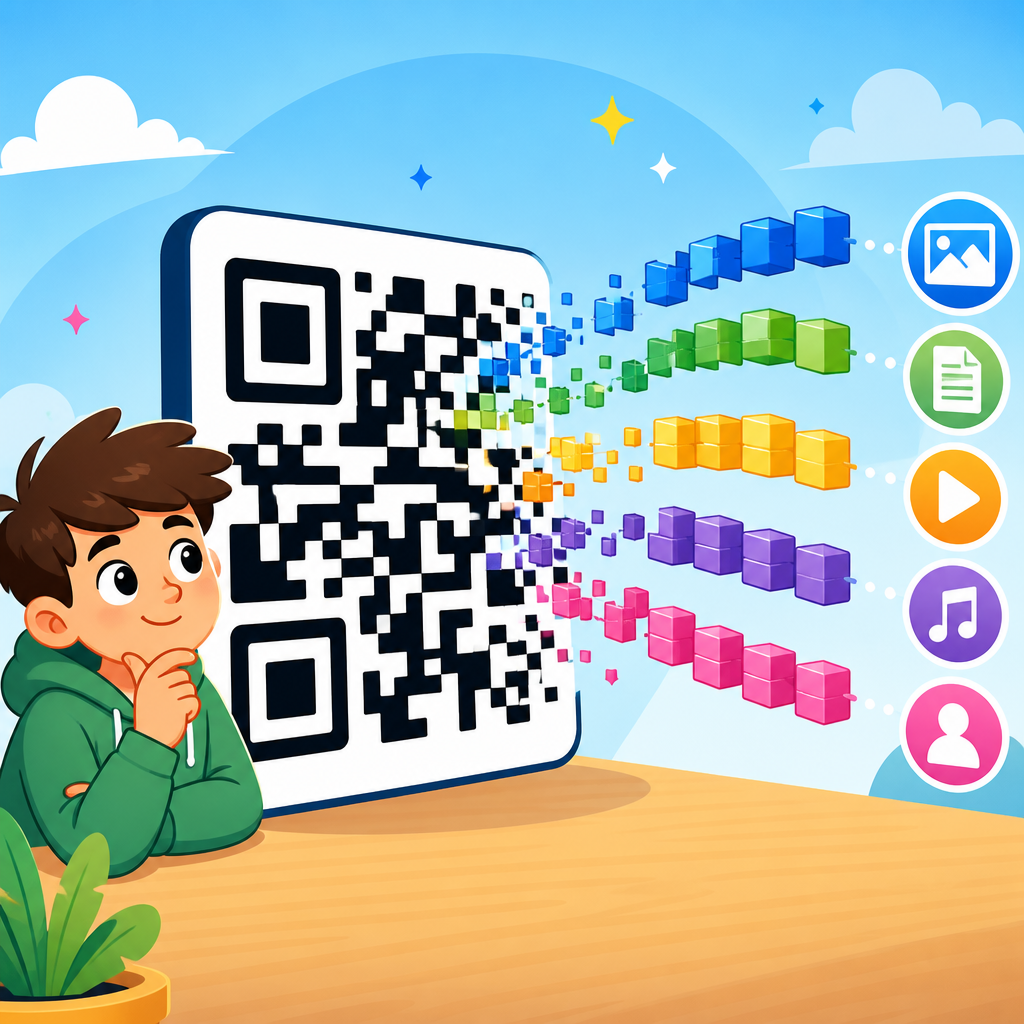
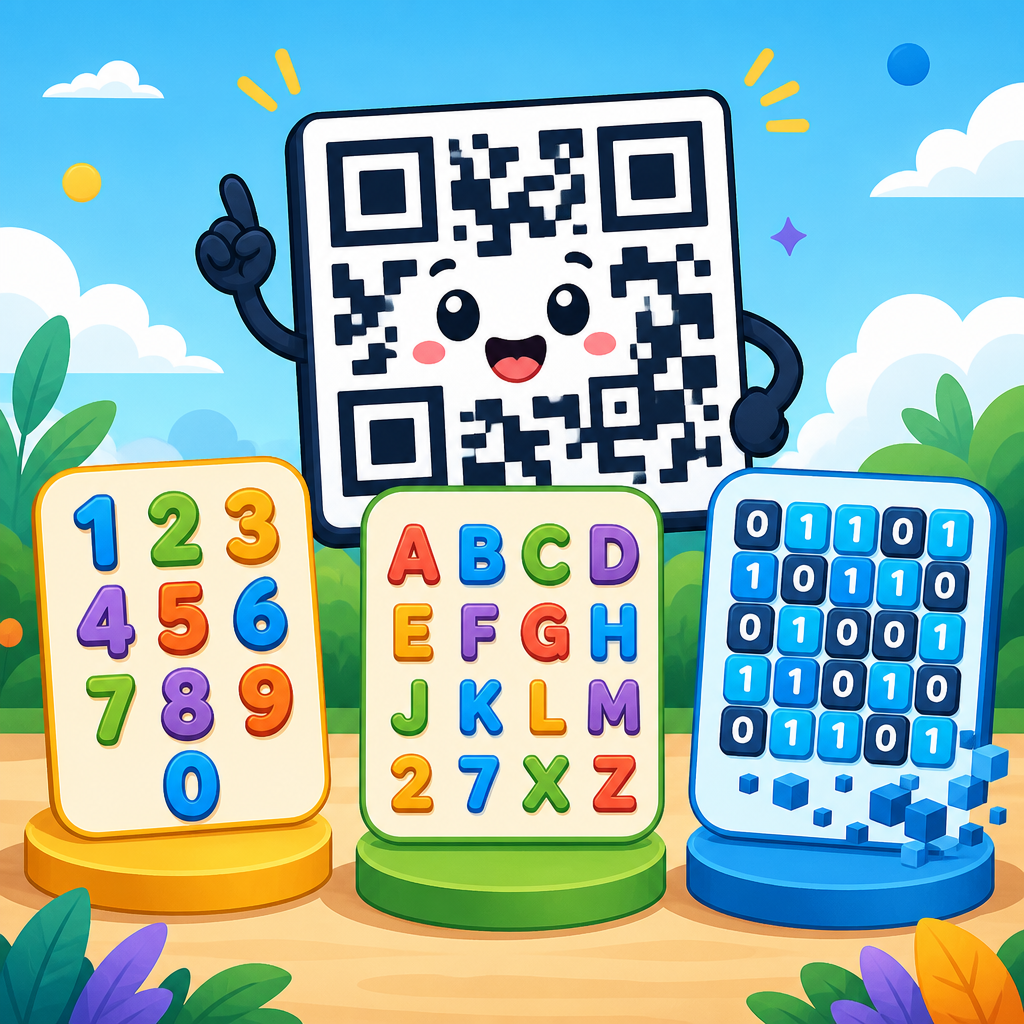
The most overlooked factor in QR Code data density is encoding mode. The standard supports numeric, alphanumeric, byte, and Kanji modes, plus structured append and ECI in advanced cases. Numeric mode is the most space-efficient for digits because it compresses three digits into 10 bits. Alphanumeric mode efficiently covers digits, uppercase letters, and a limited symbol set. Byte mode is more flexible because it can encode general character data, often in UTF-8 workflows, but that flexibility usually costs more bits per character. Kanji mode is optimized for Shift JIS double-byte characters and can be extremely efficient for the right content.
Mode choice can shrink or inflate a symbol dramatically. Consider a 20-character tracking ID made only of digits. In numeric mode, it needs far fewer bits than the same data forced into byte mode by a careless generator. The same happens with URLs. A clean uppercase alphanumeric token like ABC123PROMO2026 may fit compactly, while a long mixed-case URL with query strings, percent encoding, and analytics parameters can push the symbol into a much larger version. In many projects I have reduced printed code size simply by shortening the destination URL through a controlled redirect and preserving only the parameters needed for reporting.
Extended Channel Interpretation, or ECI, is important when multilingual or non-default character encoding is required, but it adds overhead. Structured append lets multiple QR symbols act as one message, though it increases operational complexity and is rarely ideal for consumer scanning. The right rule is simple: choose the most efficient mode that accurately represents the data and avoid unnecessary characters. Payload discipline often delivers greater gains than any cosmetic design tweak.
Version, error correction, and real capacity tradeoffs
In QR planning, “maximum capacity” tables are useful, but they can mislead teams that ignore real-world constraints. The advertised maximum of thousands of numeric characters applies only under ideal mode selection and within the symbol’s structural limits. Real payloads are usually URLs, identifiers, vCards, Wi-Fi strings, signed tokens, or application-specific commands. These often require byte mode, mixed content, or additional metadata. As soon as you raise error correction or include a logo, practical capacity drops further.
A small code with aggressive density may scan perfectly on a current flagship phone in bright light and fail on an older warehouse device under fluorescent glare. That is why symbol design should start from the use case. Consumer marketing codes viewed at arm’s length behave differently from DPM-style industrial marks, boarding passes behind scratched screens, or shelf labels printed on thermal stock. The technical objective is not to maximize data stored. It is to maximize reliable scans at the smallest acceptable footprint.
| Factor | Effect on Density | Practical Impact |
|---|---|---|
| Numeric mode | Highest character efficiency for digits | Best for serial numbers, PINs, and numeric IDs |
| Byte mode | Lower efficiency but broad compatibility | Common for URLs, app links, and mixed-language text |
| Higher error correction | Reduces payload capacity | Improves resilience to damage, logos, and dirty surfaces |
| Larger version | Increases total modules | Allows more data but may force tiny modules if print area is fixed |
| Shorter payload | Improves effective density | Often the fastest way to reduce symbol size and increase scan speed |
Error correction levels are commonly explained as L, M, Q, and H, roughly restoring about 7 percent, 15 percent, 25 percent, and 30 percent of codewords respectively. Those percentages are useful shorthand, but they are not permission to obscure the same share of visible area randomly. Recovery depends on block distribution and the nature of the damage. I have seen branded codes fail because the central logo overlapped critical regions unevenly even though the nominal correction level seemed generous. Testing matters more than assumptions. If branding is required, select the correction level deliberately, keep logos modest, and verify results across devices and distances.
QR Code formats and variants within the standards landscape
When people say “QR format,” they often mean several different things: symbol family, payload syntax, image file type, or application convention. Within standards and formats, it helps to separate these layers clearly. Standard QR Code Model 2 is the mainstream format used across retail, payments, packaging, and consumer links. Micro QR is designed for smaller labels with lower data needs. Rectangular Micro QR, standardized later, fits narrow spaces where a square symbol is inefficient. iQR Code supports even broader sizing flexibility and very large capacity, though ecosystem support is less universal than standard QR.
There are also application-layer formats riding on top of the symbol. A Wi-Fi QR encodes a specific text syntax recognized by many phones. A vCard QR follows contact data conventions. Payment QR systems such as EMVCo merchant-presented codes define field structures, identifiers, and validation rules above the core symbol standard. GS1 Digital Link uses web URIs and resolver logic to connect product identifiers with online resources. These are not competing symbologies so much as structured payload formats that depend on the underlying QR standard. For a hub page, that distinction is critical because implementation problems often come from mixing the layers.
Output format matters too. SVG is usually best for print because it is vector-based and scales without introducing anti-aliasing artifacts. PNG works well for digital distribution when exported at sufficient resolution and with sharp module edges. JPEG is generally a poor choice because lossy compression can blur module boundaries. For production teams, “format” must therefore be discussed at three levels: symbol standard, payload convention, and export file type. Confusing those categories leads to preventable scan failures and inconsistent governance.
Design, printing, and scanning rules that limit usable density
Usable density is constrained by physics and device behavior. The quiet zone, typically four modules wide around the symbol, is not optional decoration. It isolates the code from surrounding graphics and helps detection algorithms identify boundaries. Module size must remain large enough for the intended scanner and distance. On packaging lines, ink spread, substrate texture, and curvature can distort small modules. On screens, low brightness, reflections, pixel rounding, and screenshot recompression can degrade crispness. A dense symbol that looks fine in design software may become unreliable after printing, lamination, or app rendering.
Color and contrast are equally important. The safest pattern remains dark modules on a light background with strong luminance contrast. Inverted codes can work in some apps but reduce compatibility. Decorative gradients, patterned fills, and low-contrast brand palettes usually lower scan margins. If a campaign requires visual styling, keep finder patterns pristine, preserve contrast, and test under realistic conditions, including older Android devices and lower-end cameras. In my experience, scan problems blamed on “bad generators” are more often caused by small module size, poor contrast, or overdesigned artwork.
Testing should include print verification and device diversity. ISO/IEC 15415 is the established print quality measurement standard for two-dimensional symbols, and verifier tools grade attributes such as symbol contrast, modulation, axial non-uniformity, and grid distortion. While many consumer deployments will not use a formal verifier, the principles still apply. Scan the code at expected distances, angles, and lighting levels. Print on the actual stock. If the code is mission critical, test after abrasion, folding, or moisture exposure. Density is only valuable when the symbol survives the context in which it is used.
Best practices for choosing the right QR Code format
The best QR Code format is the one that meets the payload requirement with the lowest operational risk. Start by classifying the data: numeric identifier, alphanumeric token, URL, contact record, payment payload, product URI, or multilingual text. Then choose the most efficient encoding mode, the smallest version that fits, and the lowest error correction level consistent with the environment. For a clean short URL on glossy packaging, level M is often sufficient. For equipment labels exposed to abrasion, a higher level and larger module size may be justified even if it increases the symbol footprint.
Use dynamic redirects when analytics or destination changes are needed, because they keep the QR payload short while preserving flexibility behind the link. Follow application standards when interoperability matters, such as GS1 Digital Link for product identification or EMVCo conventions for payment acceptance. Export vectors for print, raster only when controlled, and never judge success by whether one phone scanned once. Judge it by repeatable performance across devices and conditions.
As a hub for QR Code standards and formats, the central principle is straightforward: data density is not a race to pack in more characters. It is the discipline of matching payload, symbol structure, encoding mode, error correction, and production conditions so the code remains compact, standards-compliant, and easy to scan. Teams that understand these tradeoffs create better labels, smoother customer journeys, and fewer field failures. Review your current QR assets, shorten unnecessary payloads, verify mode selection, and test against real environments before publishing at scale.
Frequently Asked Questions
What does QR code data density actually mean?
QR code data density refers to how much information is packed into the symbol relative to the available grid of modules, which are the small black and white squares that make up the code. In simple terms, higher density means more data is being stored in the same visual area. That sounds efficient, but in real-world use it comes with tradeoffs. As density increases, each individual module becomes smaller, the pattern becomes more complex, and scanners have less margin for error when the code is printed, displayed, curved around packaging, partially obstructed, or viewed in poor lighting.
It is also important to understand that density is not just about total character count. It is influenced by the type of data being encoded, the QR version selected, and the level of error correction applied. A short numeric string can be stored far more efficiently than a long mixed-case URL with symbols. Likewise, raising error correction adds redundancy, which improves recovery from damage but reduces the amount of room available for payload data. In practice, data density is best understood as a balance between capacity and scan reliability, not simply as a race to fit the most information possible into one code.
What factors have the biggest impact on QR code data density?
The biggest factors are data mode, version, error correction level, and the physical or digital environment where the code will be scanned. Data mode matters because QR codes encode different kinds of content with different efficiencies. Numeric mode is the most space-efficient for digits only, alphanumeric mode is efficient for a limited character set, and byte mode is more flexible but usually less efficient. This means two strings with the same length can consume very different amounts of capacity depending on their character makeup.
Version is the next major factor. QR code versions range from small grids to much larger ones, and each step up increases the number of modules available to store data. More modules mean more capacity, but they also make the code visually denser if the printed or displayed size stays the same. Error correction level has a direct effect too. Higher levels reserve more space for recovery data, which helps the code survive scratches, dirt, glare, and distortion, but lowers net data capacity.
Finally, the environment often determines whether a theoretically valid code is practically usable. A dense code on a glossy label, a tiny ticket, a corrugated box, or a low-brightness phone screen may scan poorly even if it meets standard requirements. That is why experienced implementations do not optimize density in isolation. They optimize for successful scans under realistic conditions.
How do QR version and error correction affect capacity and scannability?
QR version and error correction are two of the most important design levers because they directly shape both how much data fits and how forgiving the code will be in use. The version controls the grid size. A higher version means a larger matrix with more modules, which creates more storage capacity. If you need to encode longer data, increasing the version is often necessary. However, if the final printed or on-screen size does not increase along with the version, those extra modules become smaller and harder for cameras to resolve quickly.
Error correction level determines how much redundancy is added so the symbol can still be read if part of it is damaged or obscured. Lower correction levels preserve more capacity for payload data, while higher levels sacrifice some capacity in exchange for greater resilience. In clean digital conditions, a lower level may perform well. In industrial labels, consumer packaging, outdoor signage, or anything likely to be wrinkled, scratched, curved, or poorly lit, a higher level is often the smarter choice.
The key is that capacity on paper is not the same as capacity in production. A code that stores more data at a lower correction level may look efficient in a generator tool but fail more often in the field. A slightly larger version with stronger error correction may scan faster and more consistently, which is usually the better outcome. Good QR design treats version and correction level as practical reliability controls, not just technical settings.
Why can a QR code be technically valid but still hard to scan?
A QR code can fully comply with the standard and still underperform because the standard defines structure and encoding rules, not guaranteed scan success in every environment. Real-world scanning depends on more than whether the symbol is valid. Module size, quiet zone, contrast, print quality, surface shape, lighting, camera quality, focus speed, and viewing angle all play major roles. As data density rises, the tolerance for weakness in any of those areas gets smaller.
For example, a dense code printed very small may have modules that blur together on absorbent material or break up on rough industrial stock. A code displayed on a screen may suffer from glare, moiré effects, low brightness, or motion blur. On curved packaging, the geometry of the code can distort enough to reduce readability, especially if the symbol is already dense. Even common design decisions such as placing a code too close to other graphics or trimming the quiet zone can reduce scan reliability.
This is why practitioners often say that the best QR code is not the one that stores the most data, but the one that scans instantly under normal user behavior. In packaging, tickets, labels, and onboarding flows, the operational goal is not theoretical capacity. It is dependable performance. Testing in the actual use environment is what reveals whether a valid code is truly fit for purpose.
How can I improve QR code data density without hurting usability?
The most effective strategy is not to force more data into the symbol, but to encode smarter and reduce unnecessary payload. Start by choosing the most efficient data mode available for the content. If the data can be numeric or alphanumeric, avoid defaulting to byte mode. Keep the encoded string as short as possible by removing redundant parameters, shortening identifiers where appropriate, and using redirects or compact references instead of long raw URLs when your workflow allows it.
Next, match the version and error correction level to the actual use case rather than treating maximum capacity as the target. If the code will appear on small labels or low-quality print surfaces, give it more physical space rather than pushing density higher. If the environment is harsh, preserve robust error correction even if that means a larger symbol or a shorter payload. In many cases, increasing the printed size delivers better results than trying to optimize the encoding alone.
Usability also improves when you respect production realities. Maintain a proper quiet zone, ensure strong contrast, avoid placing the code on busy backgrounds, and test across the devices your audience will actually use. A retail customer scanning from a phone in mixed lighting and an operator scanning with an industrial imager have very different conditions. The best practice is to design for the weakest realistic scan scenario. That approach keeps the code efficient, but more importantly, keeps it dependable.