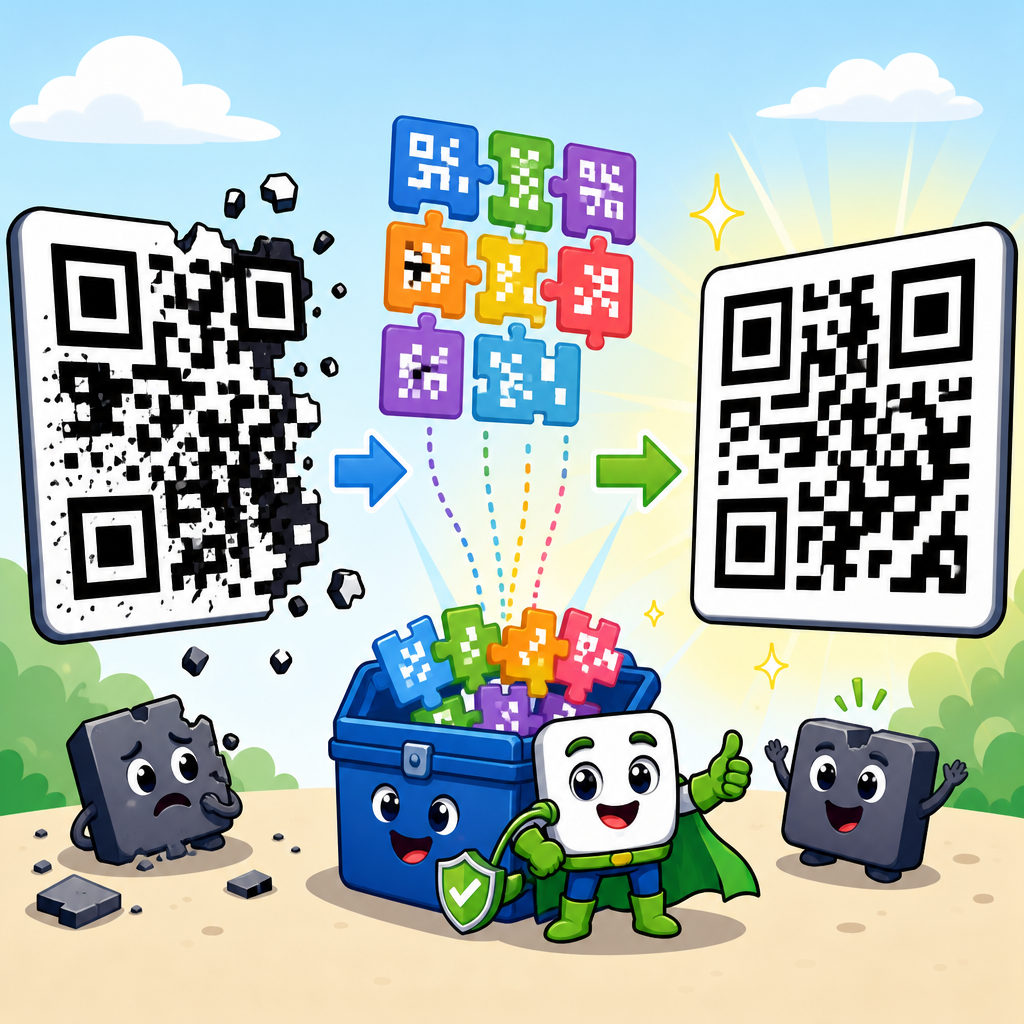
QR code redundancy is the built-in ability of a symbol to remain readable even when part of it is scratched, dirty, distorted, or partly covered. In practical terms, redundancy comes from error correction data stored alongside the original payload, allowing scanners to reconstruct missing codewords and recover the intended content. For anyone working in QR code technology and development, understanding QR code redundancy and data recovery is essential because it shapes symbol size, print reliability, branding flexibility, and scan performance across packaging, tickets, labels, menus, and industrial parts.
When teams ask what makes one QR code survive damage better than another, the answer usually starts with error correction levels. In the QR Code Model 2 standard defined by ISO/IEC 18004, four levels are available: L, M, Q, and H. These levels indicate how much recovery capacity is reserved through Reed-Solomon error correction. Level L provides the least redundancy and the highest data capacity, while Level H provides the most redundancy and the lowest capacity. In broad terms, Level L can recover roughly 7 percent of damaged codewords, M around 15 percent, Q around 25 percent, and H around 30 percent. Those percentages are useful shorthand, but the real behavior depends on version, mask pattern, module size, print contrast, and where the damage occurs.
This topic matters because error correction is often misunderstood as a simple durability switch. It is not. Increasing redundancy improves resilience, but it also makes the symbol denser or larger for the same payload. That tradeoff affects everything from smartphone scan speed to how much room remains for a logo in the center. I have seen marketing teams push straight to Level H for every campaign, only to create tiny modules that become harder to scan on corrugated boxes or low-resolution thermal labels. I have also seen manufacturers choose Level L to maximize data capacity, then discover that slight abrasion on a molded part destroys readability. The right choice depends on environment, data length, print process, and scanning distance.
As the hub article for error correction levels, this guide explains how redundancy works, what each level actually changes, how QR data recovery succeeds or fails, and how to choose settings for real deployments. It also connects the engineering logic to practical outcomes: fewer scan failures, better print tolerance, more dependable customer journeys, and more predictable field performance.
How QR Code Error Correction Works
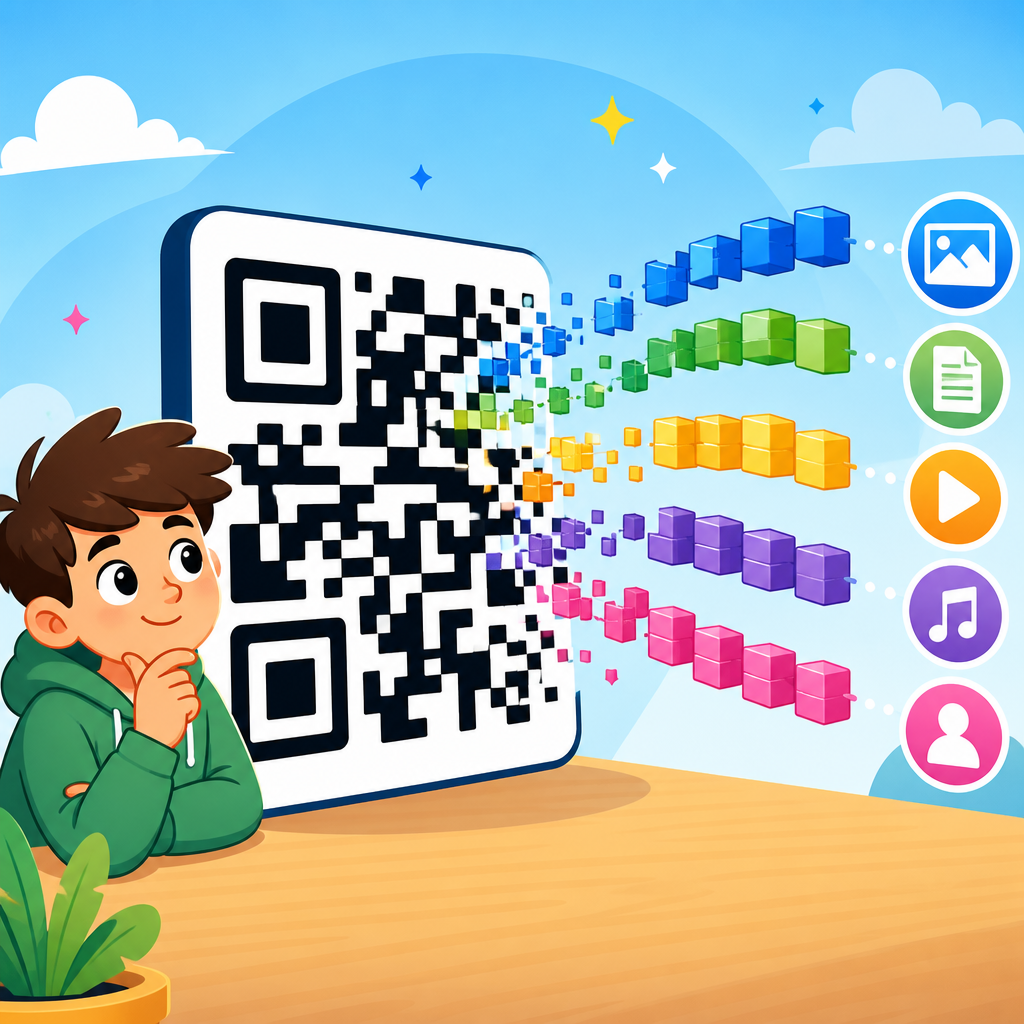
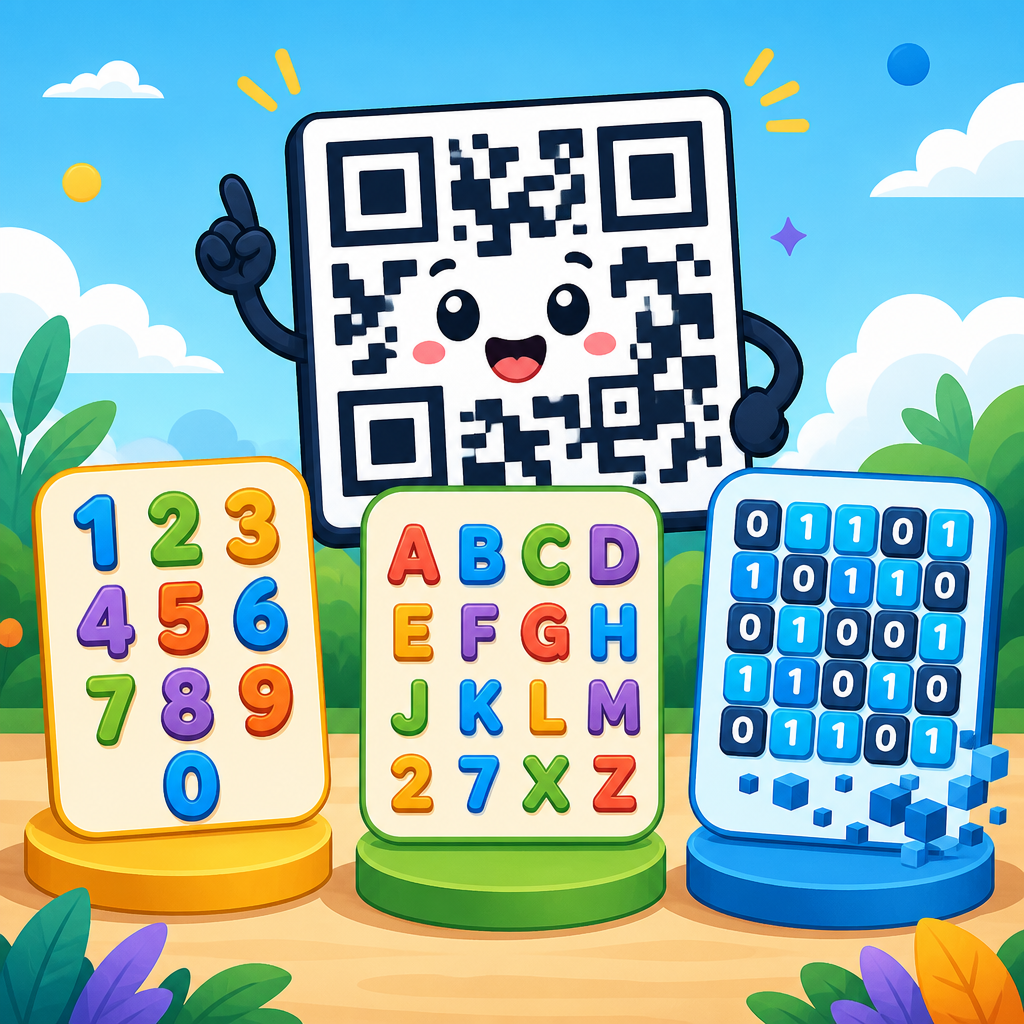
QR codes do not store raw data alone. The encoder first analyzes the content, selects an encoding mode such as numeric, alphanumeric, byte, or Kanji, then splits the payload into codewords. Additional error correction codewords are generated using Reed-Solomon mathematics over a finite field. Those codewords are interleaved with the data and distributed across the symbol according to the QR specification. The purpose of interleaving is critical: if a scratch destroys one area of the symbol, the loss is spread across multiple data blocks rather than concentrated in one place.
That structure explains why QR data recovery is often better than people expect. A code can lose a patch of modules and still decode because the scanner samples the finder patterns, estimates perspective, reads format information, applies the mask, reconstructs codewords, and uses the error correction blocks to repair erasures or errors. Recovery is not magic, though. Damage to function patterns, including finder patterns, timing patterns, alignment patterns, or format information, can be more serious than equivalent loss in ordinary data regions. A code with 20 percent visible damage may still decode, while another with less total damage may fail if the damaged area disrupts geometric reference points.
Scanner quality also matters. Modern smartphone libraries such as ZXing-derived engines, Google ML Kit, and native camera decoders differ in sampling, binarization, and perspective handling. Dedicated imagers from Zebra, Datalogic, and Cognex often outperform phone cameras in glare, motion, and low contrast conditions. In testing, I treat error correction as one component in a full scan system, not as a guarantee. Lighting, quiet zone compliance, substrate reflectance, and print gain can negate the benefits of higher redundancy.
What the Four Error Correction Levels Mean
The four error correction levels are best understood as capacity-versus-resilience settings. Level L is designed for clean conditions where preserving data capacity or minimizing symbol size matters most. It is common in digital displays, short URLs, or controlled print environments. Level M is the default choice in many generators because it provides a practical balance between symbol size and robustness. Level Q adds a stronger margin for packaging, light abrasion, or moderate design interference. Level H is used where physical wear, contamination, or deliberate central artwork is likely, but it should not be treated as universally best.
| Error correction level | Approximate recovery capacity | Best use cases | Main tradeoff |
|---|---|---|---|
| L | About 7% | Short URLs, clean digital display, controlled indoor print | Least damage tolerance |
| M | About 15% | General marketing, menus, flyers, standard labels | Moderate symbol growth |
| Q | About 25% | Consumer packaging, mild wear, partial design overlay | Lower data capacity |
| H | About 30% | Harsh handling, logos, industrial marking, long field life | Largest and densest symbol |
Those percentages are approximate because the standard expresses correction through codeword structure, block grouping, and symbol version rather than a simple damaged-area percentage. This is why a designer cannot safely place a logo over exactly 30 percent of a Level H code and assume success. The hidden issue is spatial distribution. If the logo covers key patterns or overwhelms too many related codewords in one region, the decoder may fail well before that rule-of-thumb threshold. Conservative design leaves margin, protects the quiet zone, and verifies performance with real devices.
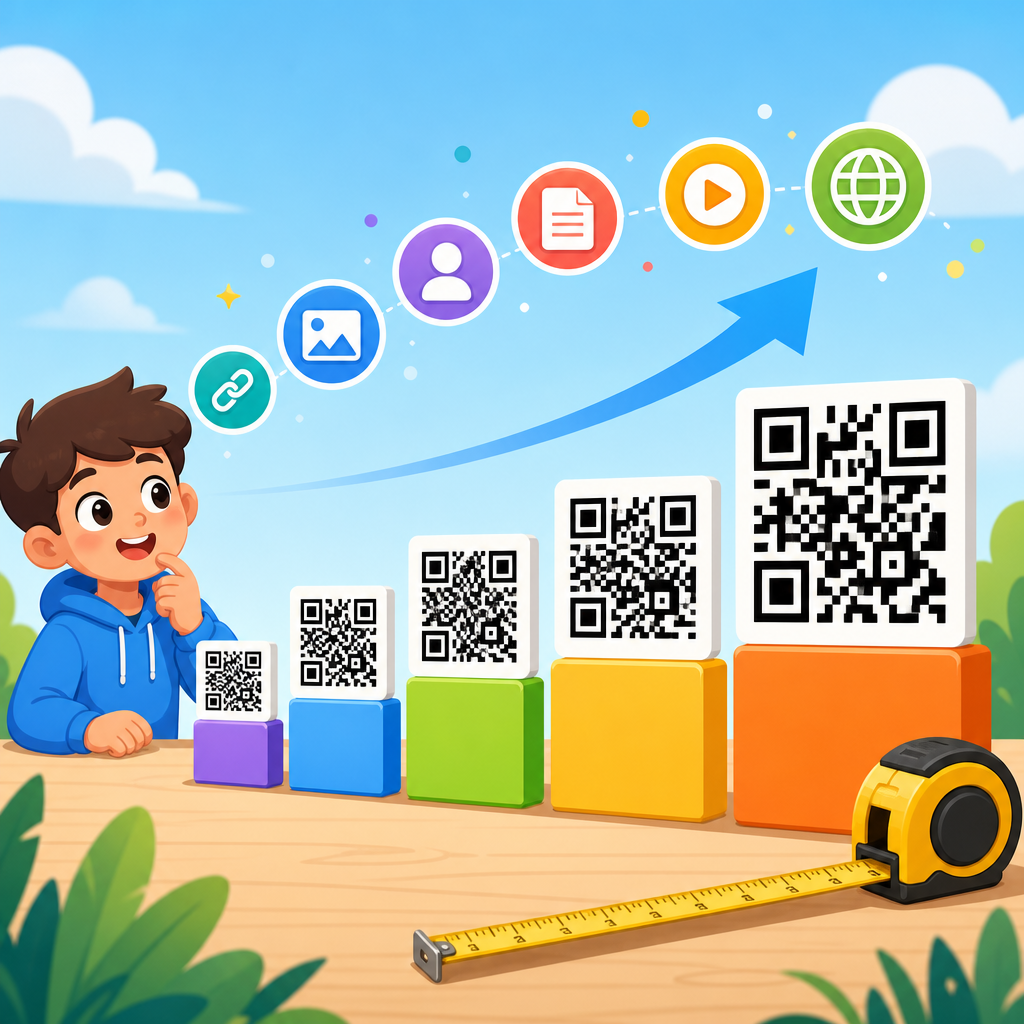
Another point many articles miss is that higher correction levels can require moving to a larger QR version. A larger version means more modules per side, which can either increase physical size or shrink individual modules. If the print area is fixed, the modules become smaller, making the code more sensitive to blur, ink spread, dot gain, and camera focus. In other words, increasing redundancy can indirectly reduce readability when production constraints force smaller modules. Good engineering weighs net scan reliability, not just nominal recovery capacity.
How Data Recovery Succeeds or Fails in Real Conditions
In field deployments, successful QR data recovery depends on the difference between random loss and structured loss. Random speckling from dust or light scratches is often recoverable because the damaged modules are dispersed. Structured loss, such as a torn corner, a fold through the timing pattern, a glossy hotspot over the center, or reverse contrast with insufficient luminance difference, is harder to overcome. Reed-Solomon correction is excellent at repairing codeword-level corruption, but it cannot help if the scanner never segments the symbol correctly in the first place.
Print quality is the most common hidden cause of failure. Thermal transfer labels can produce edge roughness; direct thermal can fade; flexographic printing can spread dark modules into light spaces; laser marking on metal can create low contrast depending on oxide color and surface finish. On curved bottles, cylindrical distortion changes the apparent module grid. On displays, moire patterns and low pixel density can create sampling errors. In each case, teams sometimes blame the error correction level when the actual root cause is symbol quality. Standards such as ISO/IEC 15415 for print quality verification and ISO/IEC 29158 for direct part marking provide a more reliable basis for troubleshooting.
I recommend evaluating damage scenarios by failure mode. If the risk is scuffing during shipment, Level Q or H may help. If the risk is low contrast from substrate choice, increasing redundancy alone will not solve it. If the risk is tiny print at long scanning distance, reducing payload or shortening the URL can outperform switching to a stronger correction level. Data recovery strategy is therefore inseparable from content strategy, physical design, and production control.
Choosing the Right Error Correction Level for Different Applications
For consumer marketing, menus, posters, and brochures, Level M is often the strongest default because it balances reliability with manageable symbol size. If the payload is a short redirect URL and the print environment is predictable, M usually scans faster and prints more cleanly than an unnecessarily dense H symbol. For branded packaging where a central logo is required, Level Q is commonly the practical ceiling before size inflation becomes noticeable. I use H only when the packaging will face abrasion, moisture, folding, or prolonged handling and there is enough physical area to keep modules comfortably large.
Industrial and asset-tracking scenarios demand a different approach. If a QR code is etched on tools, molded into plastic, or printed on labels exposed to chemicals and abrasion, higher redundancy is often justified. Even then, error correction is only one layer. Direct part mark applications may benefit more from improving cell size, contrast, and marking method than from moving from Q to H. In electronics, where labels are small and dense, payload discipline matters: serial numbers or lookup keys should be compact, allowing stronger redundancy without exceeding scanner limits.
Dynamic QR campaigns also influence level selection. If the destination is a short managed URL, you can keep the encoded payload brief and spend capacity on resilience. If the code must carry long vCard data, Wi-Fi credentials, or structured text offline, the same correction level may force a much larger symbol. That is why professional generators expose versioning, mask selection, and error correction settings rather than hiding everything behind one button. The correct workflow is to define use case, payload, expected damage, minimum print size, and likely scanning devices, then set the level accordingly and test before release.
Best Practices for QR Code Redundancy, Logos, and Recovery Testing
If you want a QR code to remain readable in the real world, start with content minimization. Encode the shortest possible payload, preferably a lowercase HTTPS short URL under your control. That single decision often allows a stronger error correction level while keeping the symbol compact. Preserve the quiet zone at four modules minimum on every side. Avoid decorative frames that intrude into that space. Maintain strong dark-light contrast, and do not rely on color combinations that look attractive but collapse in grayscale, such as red on black.
When adding a logo, keep it centered, modest in size, and clear of finder patterns, timing patterns, and alignment patterns. Many successful branded codes use Level Q with a logo covering far less than the theoretical recovery allowance. Rounded modules, gradients, and inversions can work, but they reduce tolerance. Every visual customization should be validated with actual devices, actual print methods, and actual lighting. I prefer a test matrix: at least three phones, one dedicated scanner if relevant, multiple distances, bright and dim lighting, and damaged samples including scuffs, creases, and partial occlusion. Scan ten times per condition and record first-pass success rate, not just whether one heroic scan succeeded.
Finally, document the chosen error correction level as part of your QR code specification. Teams change agencies, printers, and packaging layouts; undocumented assumptions lead to regressions. A simple standard covering payload length, correction level, minimum module size, quiet zone, contrast target, and verification method prevents most avoidable failures. QR code redundancy is valuable because it buys operational margin, but the best performance comes from disciplined design, not from redundancy alone.
QR code redundancy and data recovery are not mysterious features hidden inside the symbol; they are deliberate engineering choices that determine whether a code survives the conditions it will actually face. Error correction levels L, M, Q, and H exist to balance capacity against resilience, and each has a legitimate role. L preserves space for clean, controlled environments. M fits most everyday campaigns. Q supports packaging and modest branding demands. H is reserved for harsher handling, longer service life, or designs that intentionally sacrifice some code area.
The main lesson is simple: stronger error correction is helpful, but it is not automatically better. Data recovery depends on payload length, version growth, module size, print quality, contrast, symbol placement, and scanner capability. A well-designed Level M code with a short URL, proper quiet zone, and verified print quality will often outperform a cramped Level H code overloaded with content and decorative styling. Real reliability comes from matching the correction level to the application and validating the result under realistic conditions.
As the hub for error correction levels within QR Code Technology & Development, this article gives you the foundation for every deeper topic in the cluster, from logo-safe design and print verification to industrial marking and scanner optimization. Use it as your decision framework: define the environment, minimize the payload, choose the appropriate level, and test with the devices your audience actually uses. If you are building or specifying QR systems, review your current codes against these principles and update one live implementation this week.
Frequently Asked Questions
What does QR code redundancy actually mean?
QR code redundancy refers to the built-in resilience that allows a QR symbol to remain scannable even when part of it is damaged, obscured, dirty, warped, or printed imperfectly. This resilience comes from error correction data that is encoded alongside the original content. Instead of storing only the raw payload, a QR code also includes recovery information that helps a scanner reconstruct missing or corrupted portions of the symbol. In practice, that means a scratched label, a smudged package, or a slightly distorted code on curved material may still decode correctly.
For developers and teams working with QR code generation, redundancy is not just a nice extra feature; it is a design parameter with real consequences. Higher redundancy improves robustness in less-than-ideal environments, but it also increases the amount of data the symbol must carry. That often leads to denser modules or a larger printed code for the same payload. Understanding redundancy helps you make informed tradeoffs between reliability, symbol size, scan speed, and visual flexibility.
How does QR code data recovery work when part of the symbol is missing?
QR code data recovery works by using error correction codewords embedded in the symbol during encoding. When a scanner reads a QR code, it does not simply check whether every module is perfect. Instead, it analyzes the encoded structure, identifies data and error correction regions, and uses mathematical recovery methods to rebuild missing or unreadable codewords when damage falls within the correction capacity of the symbol. This is why a QR code can often survive scratches, folds, ink spread, glare, or partial obstruction and still return the correct result.
It is important to understand that recovery does not mean unlimited repair. The scanner can only reconstruct data if the amount and distribution of damage stay within the selected error correction level. If too much of the symbol is destroyed, or if critical structural patterns are severely disrupted, decoding may fail even if some data remains. In real-world applications, successful recovery depends on multiple factors working together: the chosen error correction level, the size of the code, print quality, contrast, quiet zone integrity, camera resolution, and the location of the damage.
What are the different QR code error correction levels, and how do they affect redundancy?
QR codes commonly use four error correction levels: L, M, Q, and H. These levels represent increasing amounts of recovery capacity, with L offering the least redundancy and H offering the most. In broad terms, higher levels allow more of the symbol to be damaged while still remaining readable. That makes higher correction levels attractive for environments where labels may be exposed to wear, contamination, outdoor conditions, handling, or decorative treatments such as logo overlays.
The tradeoff is that more redundancy requires more space within the symbol. If the payload stays the same and the error correction level increases, the QR code may need a larger version or denser module pattern to fit all required data. That can affect print dimensions, scan distance, and readability on lower-quality displays or materials. For developers, the right choice depends on the use case. A clean digital screen in a controlled setting may work well with a lower level, while industrial packaging, retail labels, event signage, and branded codes often benefit from more aggressive redundancy planning.
Why is QR code redundancy important for print reliability and real-world scanning performance?
In theory, a QR code generated correctly should scan without issue. In practice, real-world conditions introduce many sources of degradation. Printing on porous surfaces can cause dot gain. Small labels may lose edge definition. Packaging may crease. Outdoor signage may fade. Reflective finishes can create glare. Camera angles, motion blur, and low light can all reduce scan quality. Redundancy helps absorb these imperfections by giving the decoder enough recovery information to compensate for partial data loss instead of requiring a flawless symbol.
This is why redundancy is closely tied to print reliability. It provides tolerance for manufacturing variation and environmental wear, which is especially important at scale. If you are producing large batches of QR codes across multiple substrates, printers, and distribution channels, even minor inconsistencies can reduce scan success rates. Proper use of redundancy, combined with good sizing, strong contrast, and adequate quiet zones, improves the odds that codes will remain usable throughout their lifecycle. For teams responsible for customer experience, operations, or product tracking, that reliability can have a direct business impact.
How should developers choose the right level of redundancy for a QR code project?
Developers should choose redundancy based on context, not by defaulting to the highest setting every time. Start by evaluating the environment where the code will be used. Will it appear on product packaging, warehouse labels, marketing materials, tickets, equipment tags, or mobile screens? Will the surface be flat or curved? Is damage likely from abrasion, moisture, dirt, sunlight, or frequent handling? Will users scan from close range or at a distance? These factors help determine how much recovery headroom the symbol needs.
Next, weigh redundancy against payload size and physical constraints. If the code must fit into a very small print area, raising error correction too far may create modules that are too dense to scan consistently. If the content is long, consider shortening the payload, using a redirect URL, or optimizing the data format so you can preserve readability while still adding enough correction capacity. The best approach is usually to prototype several versions and test them under realistic conditions, including imperfect printing and typical user devices. In QR code technology and development, redundancy decisions are most effective when they are validated through actual scanning performance rather than assumptions alone.